
One of the lockdown conversations that has stuck in my mind was with a colleague whose 8-year old does not really want to go back to school. One of his reasons is a tribute to her homeschooling arrangements: he has really enjoyed having more personalised learning activities, with adult attention. She was very conscious of the circumstances that make this possible. Having time away from school has made all of us think more deeply about what school does and does not offer. Being in a room with 29 other children is probably not the best way to learn curriculum topics. However, learning about other people, and learning how to get along without adult attention are also purposes of education.
The other reason for her son’s reluctance is that he is worried about catching the virus. They have talked about keeping safe, and what he can and cannot control in his environment. This is a time when it would be helpful for an 8-year old to have an understanding of low and high probabilities and low and high risk. 
What does it mean to understand probabilities? Coincidentally there has been a recent study suggesting that parrots can do probability The researchers taught the parrots to take tokens from their closed hands: if the revealed token was black they gave them a treat, but an orange token gets them nothing. Then the parrots are shown two jars, each containing a mix of black and orange tokens – in different proportions. The researchers pick a token out of each jar, hiding them in closed fists. The parrots consistently chose the fist corresponding to the jar that has higher proportion of black tokens. It is a fascinating study, and there is more to it. But are we sure that parrots understand probability? Maybe they understand ratio? Maybe understanding ratio supports them in making an aesthetic or emotional choice, based on preferring the look or the associations of the black-er jar. Are we sure their choice is based on predicting long term frequencies? How could we actually tell?
When we talk to children about probabilities of catching an illness, these differing aspects of probability are all involved. One of the aspects they need to learn is ratio, and another is big/small numbers, because the chance of an 8-year old getting a severe case of COVID is very low. Another is using probability – a mathematical measure of chance – to make predictions about long-term likelihood.
We often teach probability in schools through practical experiments. Experiments with dice and spinners are active and memorable and they help children establish a broad connection between theoretical probability and long-term expected outcomes. They work fairly well when we are interested in outcomes that are reasonably likely to happen. A popular activity is the ‘horse race’ modelled by adding the score on two two dice: horse #7 will usually win. The probability of throwing a 7 is 6/36, while the next most likely scores are 6 and 8 with probability 5/36. In my experience, after 15 throws, 7 does win. This aids children’s appreciation that it is more likely than any other score. ( Now I ought to go and calculate this theoretically – why 15 and not 10?).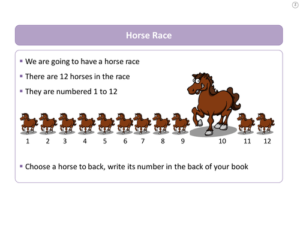
But there are tensions in using practical experiments to appreciate low probabilities. A practical experiment ‘showing’ that a chance of 1 in 100 is unlikely to happen is necessarily boring to take part in. It won’t maintain a child’s interest. And there is an issue too that we are relying on the salience of experience, but you cannot control the outcome of a random event – it may be that the child does roll the dice and get something that feels like the very rare result more often than the probability suggests ( and sometimes children will make unexpected connections, for example ‘I didn’t get two 1s but I did get two 3s and that’s nearly the same’) .
Prof David Spiegelhalter estimates that the risk of an under 15 catching and dying of covid 19 is 1 in 5.3 million. That is very, very unlikely. It would be a very boring experiment to model. But how to make sense of it. With older people you can use an analogy: their risk is the risk of driving for a year all bundled into a few weeks.
And risk – that is even more complicated than probability – as it takes into account the severity of the outcome as well as its probability. For me the driving analogy works because I do know a few people who have been killed while driving – and I also know many, many people who haven’t. I can start to appreciate the scale and severity of risk. A teenager won’t necessarily know of anyone, and may envisage low risk as no risk, or may be over-influenced by one close event. In any case often when children act it is not because they are assessing risk, its because they are unconscious of it or ignoring it.


Our conversation about explaining risk ended up returning to sweets – the bags of mixed flavours that contain some you like and a few you don’t. There’s lots to talk about here: If I offer you a sweet from the bag, would you take it? Even if you only know the nasty flavour when its in your mouth? Would you buy a whole bag for yourself? If you were making a bag of 100 sweets, how many nice ones would you put in and how many of the nasty ones? Suppose someone buys a HUGE bag, enough for your whole school to have one, but you know there is one nasty sweet in there – would you take one? One in 5.3 million is a thousand children eating a sweet every day for one and a half years and finding just one bad one.
Of course the nature of the outcome matters as well – sweets aren’t frightening, although they can be imagined as very repulsive. I think that makes it quite a nice context to play about with. Going back to school has many things you do enjoy, and a small chance of something bad.