
Up until recently I used to email monthly benchmarking of ORO to members of the research community here at the OU. I still think it’s useful to see how we are doing so I’m going to post some figures here and some discussion.
ORO continues to be one of the most popular Institutional Repositories by downloads as recorded by the IRUS service. The Top 20 IRUS download figures for March are:
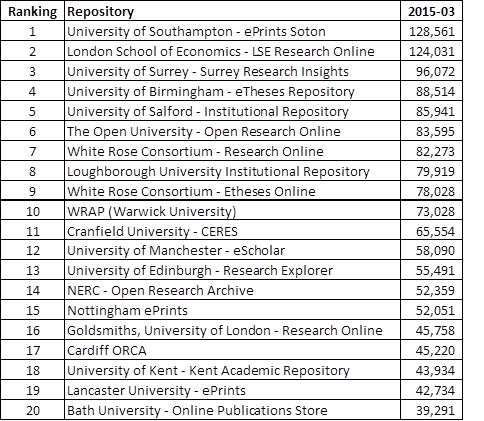
So again ORO is high on the list of participating repositories and keeing very good company with repositories from institutions with a higher research capacity than the OU.
But these counts don’t take into account a couple of things. Firstly, how many items are in the repository. ORO has nearly 28K items but some repositories have over 100K items and UCL has over 300K items it! Secondly, what percentage of full text items are actually in the repository (some IRs are full text only so are 100%) whereas others are hybrid and will have a percentage of something like 10-30% (ORO has 26%).
So what happens if you do something very simple like divide the number of downloads by the number of items in a repository? Well you get something like this (data from IRUS and OpenDoar from March 2015):
Click to enlarge (PDF available here: Downloads per repository)
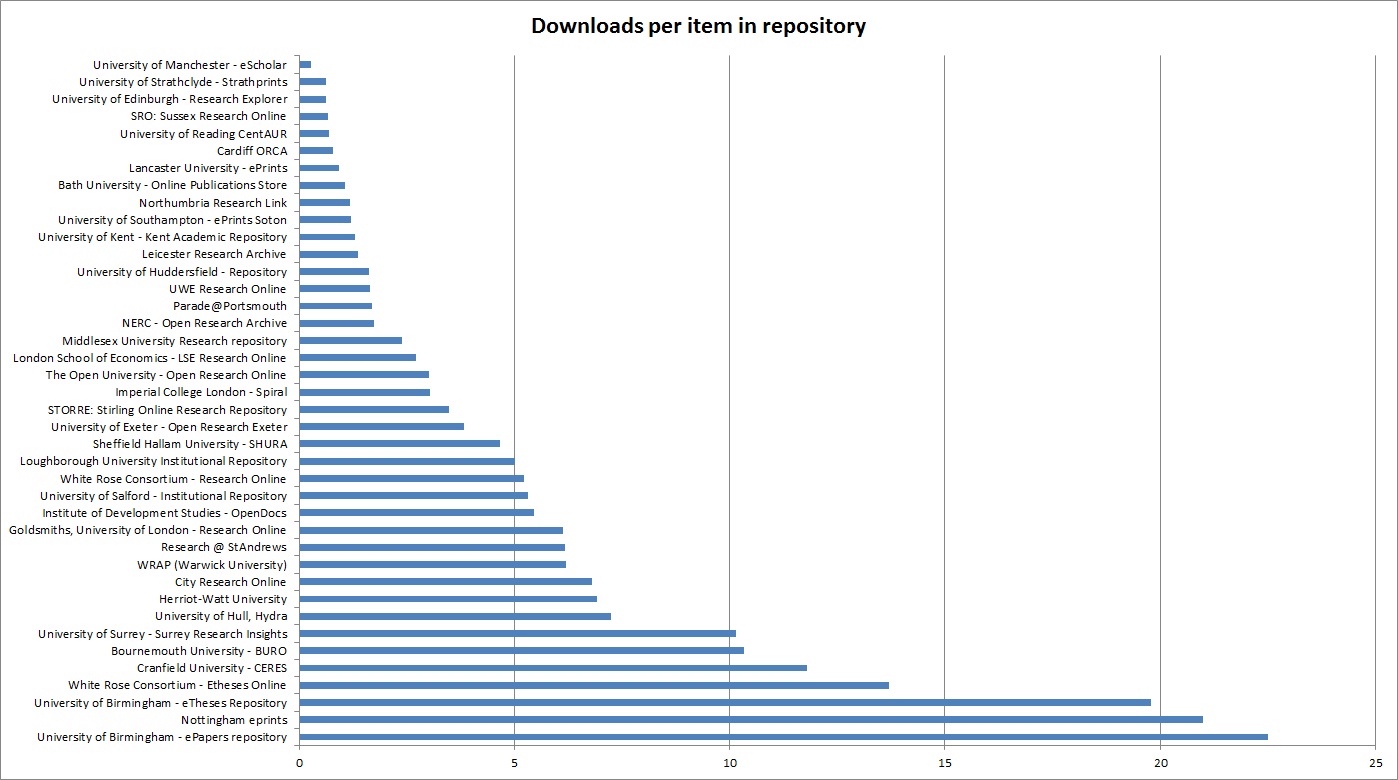
So full text repositories record downloads of 5-22 per item – and these will be the repositories at the bottom of this graph. Hybrid repositories will be getting 1-6 downloads per item, you’ll see ORO gets around 3, and will be at the top and middle of the list.
What’s interesting (to me) is that there is no step in the graph between hybrid repositories and full text repositories, rather they merge. In fact some hybrids have a better download per item than full text repositories. Moreover, why is there such variation within either full text repositories (5-22) or hybrid repositories (1-5).
What does it tell us about the performance of some repositories over others? Are they more visible to google? Are the materials in those repositories more likely to be downloadable? I don’t know.
What I’d love to see are figures of % Open Access for Institutional Repositories – aggregated by a service like IRUS. If we had this data we could do some more sensitive benchmarking. Understanding how some institutions get more full text into their repository AND make it visible to the reader would benefit the whole community and consolidate the position IRs increasingly have in scholarly communications.