-
Playful Learning 2022: Reflections and conference-in-a-pod
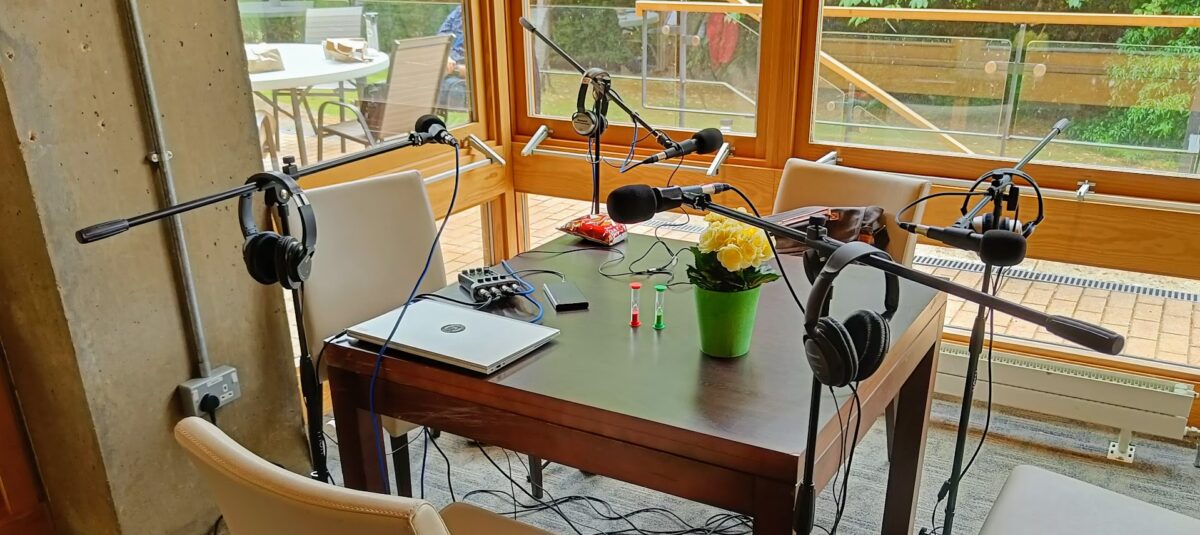
It’s a few weeks after the Playful Learning conference, and even after a bit of time to decompress I’m still a buzzing, overstimulated mess. And you know what? I’d do it all again in a heartbeat. In this article and accompanying podcast, I’d like to share my take on the conference: my impressions, my takeaways,…
-
Conference to practice: reflecting on a week at ALT-C

I’ve been a Learning Designer for three years now, and ALT-C (The Association for Learning Technology Conference – September 2021) was my first conference within the role. While I’d never expected my first experience with this to be online, I must say I thought it was fabulous.
-
Workload mapping part 3: concurrency and activity makeup

In this series of posts, we’ve been looking at student workload mapping. This final post looks at the other neat things we can do once we’ve mapped out a module. Our example student, Alex, has had their workload smoothed out in the previous posts. Now that we’re sure the volume of learning and teaching for…
-
Workload mapping part 2: mapping in learning design

In this series of posts, we’re looking at student workload mapping. This second post explains how we monitor workload during module design, and where we might make recommendations to authors. Overall workload for a module is agreed right at the beginning of learning design, with set times to aim for based on the level of study,…