Causal Loop Diagram Mapping is a knowledge cartography technique Developed by Meadows and colleagues in 1972. Causal Loop Diagram (CLD) Map supports learners to visualize and understand the interconnected causes and effects within a system. This technique is useful for analyzing system behavior how different elements influence one another through feedback loops and identifying leverage points for intervention.
How can we create a CLD Map?
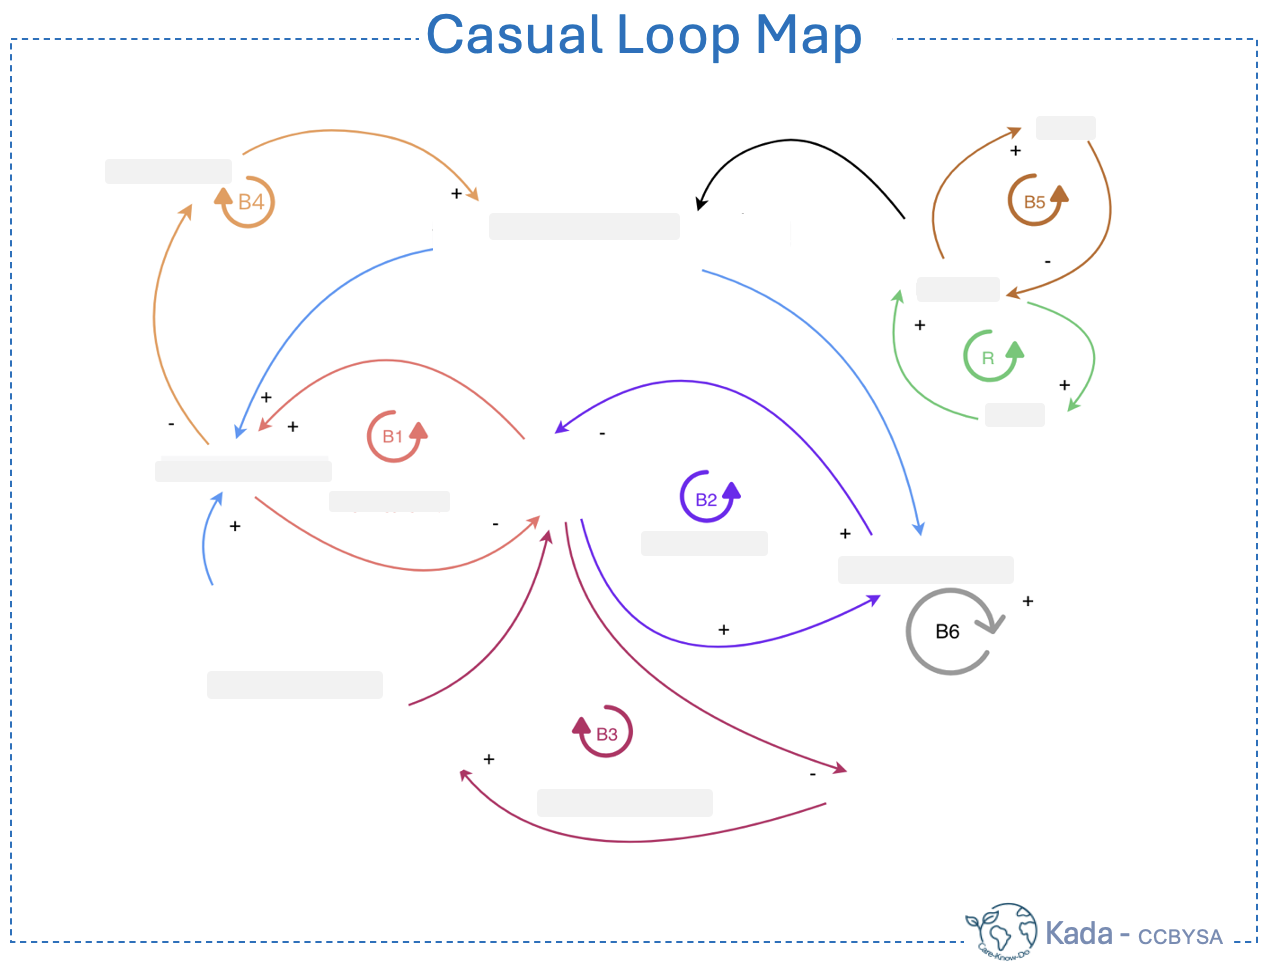
- Identify key variables in the system.
- Determine the cause-and-effect relationships between variables.
- Use arrows to connect variables, indicating the direction of influence.
- Label the arrows with positive (+) or negative (-) to show the type of feedback.
- Identify and mark reinforcing (R) or balancing (B) loops.
- Analyze the loops to understand system behavior and potential changes.
CLD Maps can help students to grasp the dynamics of ecosystems, economies, and social systems.
The application of CLD Maps is widespread in environmental studies, business strategy, and public policy.
Our studies about CLD Maps using AI map application indicate an enhancement in systems thinking and complex problem-solving as one of the main advantages.