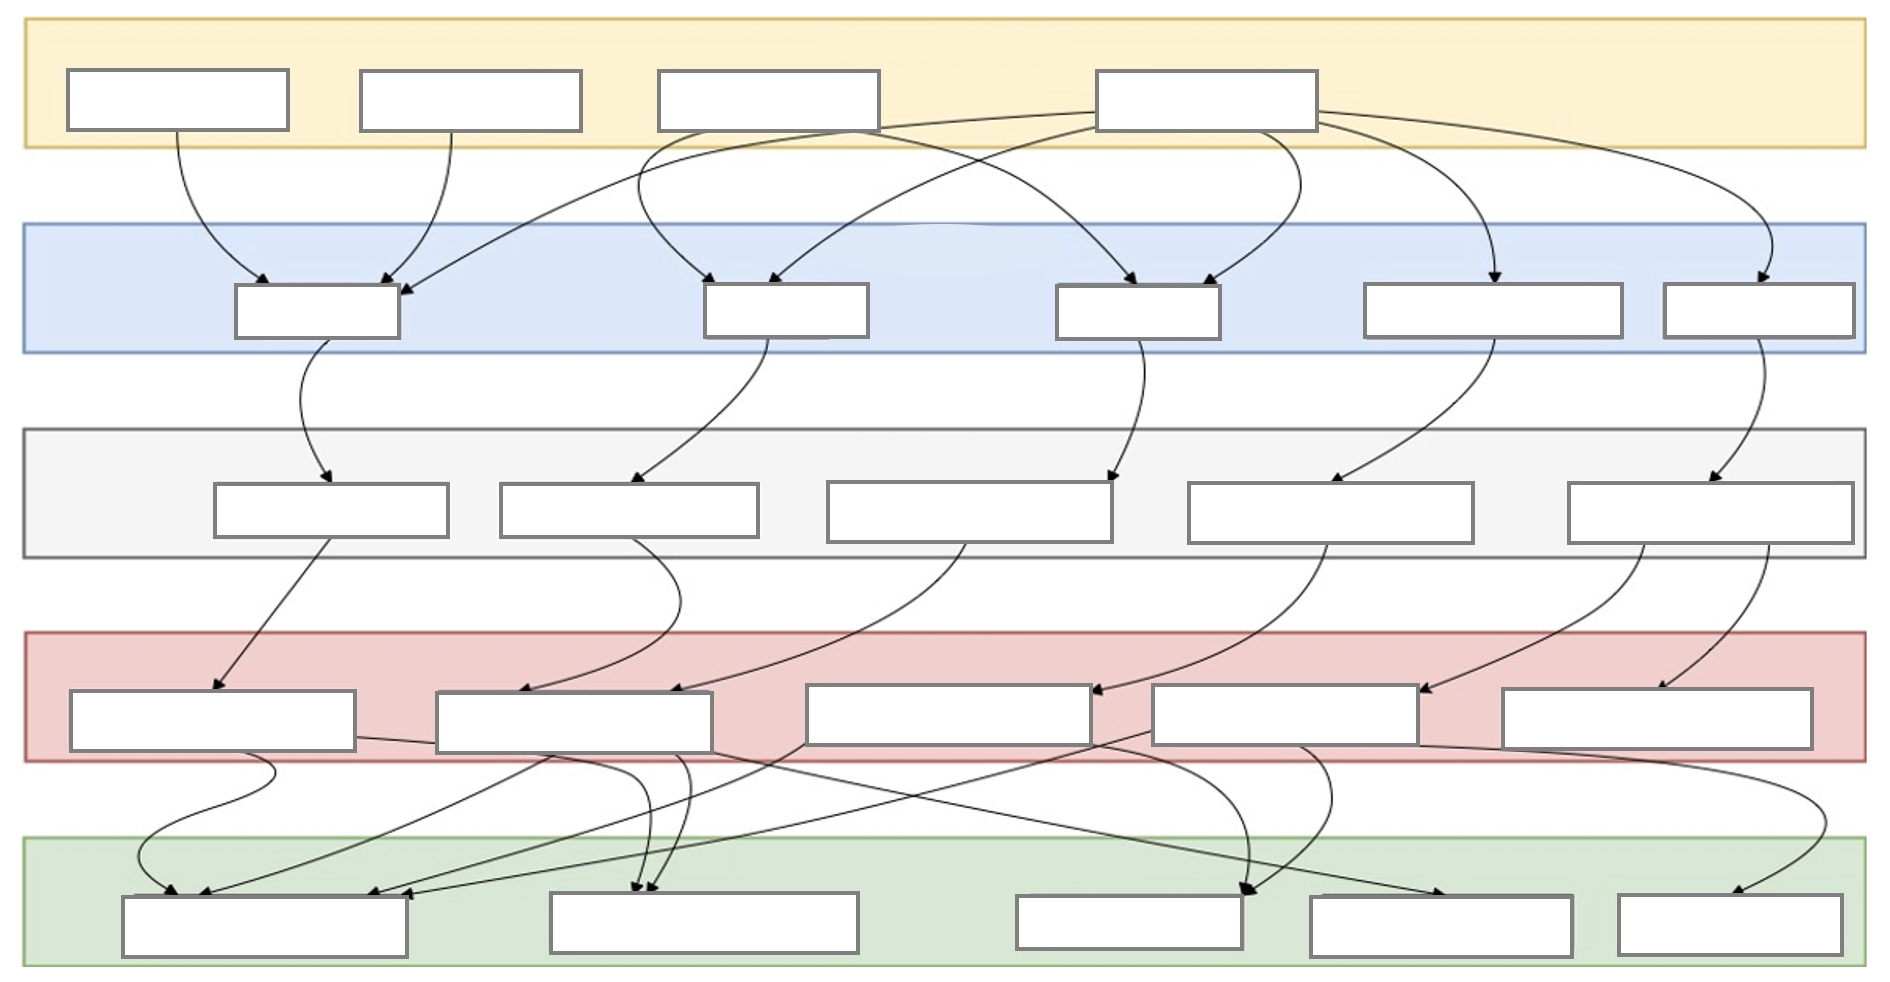
System Dynamics Diagram Mapping is a knowledge cartography technique that became more widespread with the work of Forrester in the 1950s.
System Dynamics Diagram Mapping supports learners in visualizing and analyzing complex systems and their interdependencies.
It is useful for understanding dynamic behavior and feedback loops in various contexts.

How can we create a System Dynamics Diagram Map?
- Identify key variables and elements of the system.
- Determine relationships and interactions between these elements.
- Map feedback loops and causal links.
- Represent stock and flow diagrams where applicable.
- Analyze the impact of changes within the system.
- Use the map to predict system behavior and identify intervention points.
System Dynamics Diagram Maps can help students to grasp the complexities of ecological, economic, and social systems.
The application of System Dynamics Diagram Maps is widespread in environmental studies, business strategy, and public policy analysis.
Our studies about System Dynamics Diagram Maps using AI map application indicate enhanced simulation and forecasting capabilities as one of the main advantages.