
In this series of posts, we’ve been looking at student workload mapping. This final post looks at the other neat things we can do once we’ve mapped out a module.
Our example student, Alex, has had their workload smoothed out in the previous posts. Now that we’re sure the volume of learning and teaching for this module is manageable we can start checking that it fits in with the wider context of their studies, and that the studies themselves are suitably varied and engaging. We’re able to do this with our existing mapping data through Concurrency and Activity mapping.
Concurrency mapping
The Open University has an increasing number of students studying FTE (Full Time Equivalent – 120 credits a year). As the majority of modules run throughout the course of the academic year, this results in modules overlapping one another. While proactive workload mapping has smoothed both over in our examples, assessments, and small dips and spikes can be magnified to the same damaging proportions as we discussed in our first post.
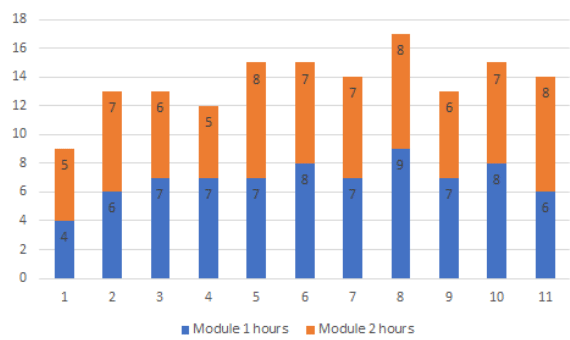
By taking the mapped workload from both modules and laying the week-by-week workloads over one another, we can see the concurrent workload for students studying both modules. In this case, a small overrun in both modules in week 8 has generated an unwanted spike, that could lead to the same negative outcomes demonstrated with Alex, our example student, in part 1 <link>.
We might also see this with assessments, where the likelihood of a higher student-directed workload (from a student revisiting material, researching and drafting an assignment) impacts the overall study time available for a week. This is a particular concern at level 1, where students are still building their time management skills – and may struggle to prioritise conflicting assessments across multiple modules.
Our example student Alex may opt to prioritise the assessment on the core module of the qualification, and devote less time to an optional one – or feel overwhelmed by the sudden influx of self-directed workload and perform worse on both. While part of the solution to this is scaffolding and studentship activities, which build study skills throughout the module, maintaining an awareness of potential concurrency during design allows both calendars to be nudged towards a more harmonious alignment. This is most useful when a new module is being designed, and a relationship between that and an existing module can be predicted.
Activity makeup
Back in part 2, we mentioned mapping directed activities. While doing this, we divide those activities in to:
- Assimilative – read/watch/listen (this category includes most non-directed teaching material)
- Interactive/Adaptive – explore/experiment/simulate
- Experiential – practice/apply/experience
- Communicative – debate/discuss/share
- Finding and handling information – analyse, collate, discover
- Assessment – write/present/report
- Productive – create/build/produce
An aspirational makeup of these activity types is decided right at the beginning of the module design process – taking into account the subject, student demographics and more. Module mapping allows us to revisit that aspiration during design and see if it’s on track:
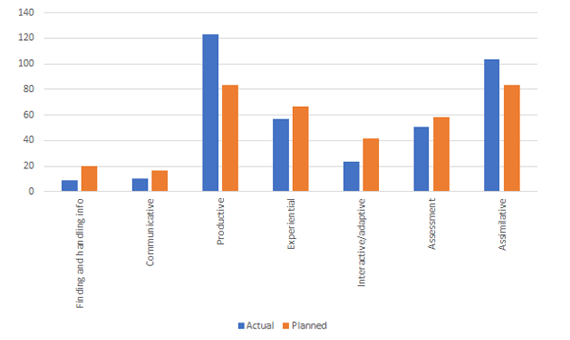
In this case, we can see the module has ended up with more productive and assimilative activities than initially planned. If we wanted to, we could filter this down to a unit or week level to see if particular sections are skewing the results and suggest structural tweaks. Alternatively, this may just be the natural evolution of the module’s teaching direction as it develops – and might not be a cause for concern.
Sense checking against student profiles is a quick way of pulse checking activity makeup. In this case (mapped from our example level 1 module) we’re happy to see that Alex would enjoy a broad spread of activities while studying this module – but we would suggest boosting the finding and handling information activity time slightly, in order to better build towards expectations at level 2. We would also like to see more communicative activities at level 1, in order to help Alex better integrate in to the student community.
While Alex is a figment of our imaginations, much of the data in this series of posts has come from modules at various stages of development. Quantifiable factors in learning and teaching will never tell the whole story – but hopefully we’ve demonstrated the differences that can be made through proactive evaluation, and student focused thinking.
If you enjoy a good graph as much as us, or would like to know more about module mapping and our other evaluation work then let us know via twitter @OU_LD_Team.