
Why are multiple representations important when learning and doing mathematics?
One of my favourite starter problems which I picked up as a secondary mathematics teacher involves a spider, a fly, and a room in the shape of a perfect cube. The spider is sitting in one corner of the floor, whilst the fly is hanging off the ceiling in the opposite corner. If one side of the cube is three metres long, what is the shortest distance which the spider can travel to reach the fly?
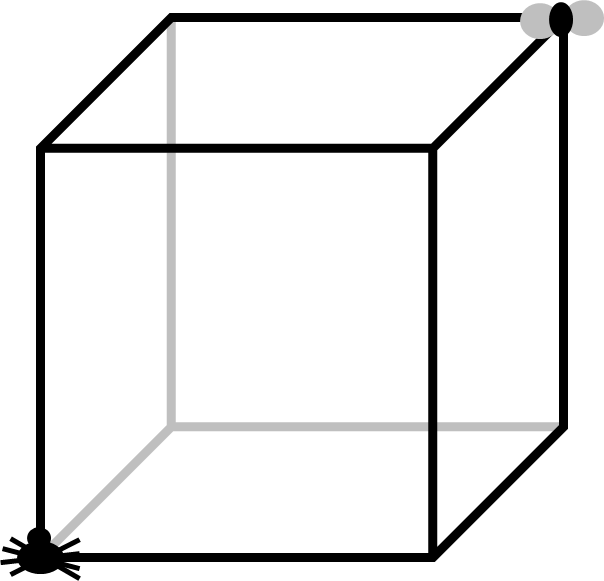
Once I had clarified a few important details, (no year eight, spiders don’t wear jetpacks,) typical answers from the class would include travelling along three edges of the cube – a total of 9 metres – or crawling diagonally across the floor and then up one wall; using Pythagoras’ theorem this distance would be the square root of 18 plus 3 metres, a total of about 7.2 metres. However, the best possible answer is closer to 6.7 metres. The pictures below illustrate how this result comes about.
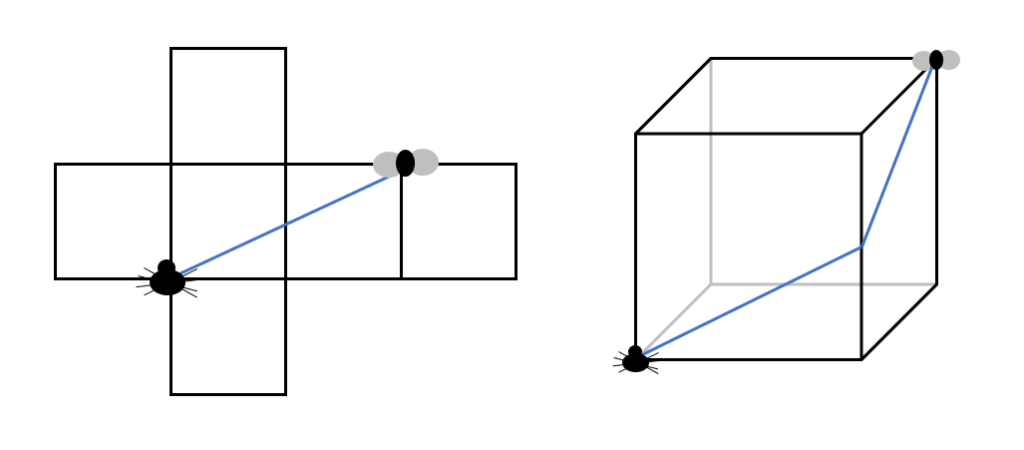
For many learners, switching from three dimensions to two, and representing the problem on a net of the cube is what gives rise to an ‘aha’ moment. It becomes transparent that the shortest distance is a straight line, and all that is left is the calculation.
The Value of Multiple Representations
The spider and fly puzzle is far from being the only mathematical problem where a change of perspective can empower and enable learners. This is why The Open University’s mathematics education module ME322 talks about learners meeting, choosing between, and connecting different representations. When learners can represent mathematical objects and concepts in more than one way, they develop more flexible understandings and have access to different avenues of investigation.
The value of representations can be seen throughout school mathematics, starting with some of our earliest work with number. Drawing multiplication facts as arrays can help young learners to see how multiplication is repeated addition (here 5 x 3 = 5 + 5 + 5) and to recognise the commutativity of multiplication (in this case 5 x 3 = 3 x 5).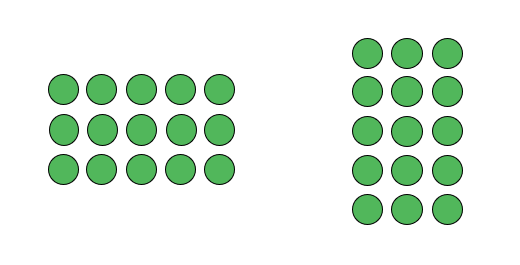
There’s a subtle shift in how the representation is supporting mathematical thinking here. In the spider and fly puzzle the net representation helped to solve a specific problem, but now the array representation informs our mathematical understanding of multiplication and how it works. With appropriate prompts and experience, most learners will recognise that the visual switch in orientation keeps the product the same for any numbers, not just 3 and 5. Using representations to reveal structure is one of the central ideas in mastery approaches to teaching mathematics.
Taking Advantage of Multiple Representations
Alternative representations don’t have to involve pictures. Further along in their study of number, pupils meet decimals and fractions, two different symbolic representations of proportions or parts of a whole. Each has its own strengths in both application and calculation. For example, I find that school-aged learners would usually rather add 0.4 and 0.25 than 2/5 and 1/4. On the other hand, it’s quite demanding to square root 6.25 without a calculator, but rerouting through fractions makes it more straightforward: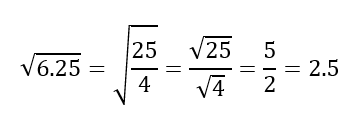
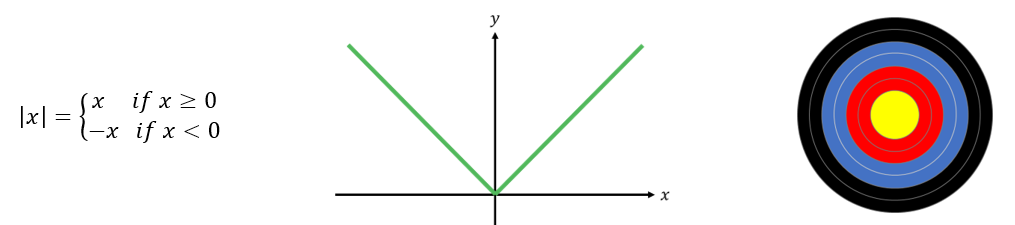
Another topic where multiple representations are highly useful comes from A-level mathematics. The modulus (or absolute value) function f(x) = |x| returns the non-negative version of any number. For example, the modulus of 10 (written |10|) is 10 and the modulus of negative 10 (written |-10|) is also 10. This function can be defined as a piecewise function, represented by its graph, or considered as the distance from the origin. A visual metaphor for this is hitting a target in archery. To work out how many points you score, you only look at the coloured rings, which show the distance from the centre; it doesn’t make any difference whether you are off to the left or off to the right.
I find it interesting how (and when) learners switch between equation, graph and distance representations as they move through different types of modulus function questions. To solve the first equation in the box, a learner might typically call on a definition to reach the two answers of a = 8 and a = -8. 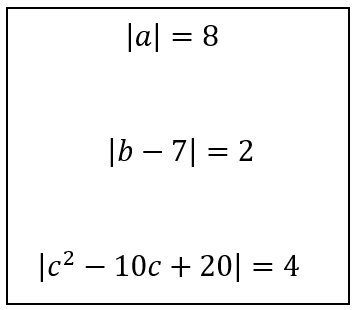 However, the second question can be solved using different approaches. Some learners rewrite it as two separate linear equations: either b – 7 = 2 or b – 7 = -2. Others instead think about it in terms of distance: which two numbers satisfy the statement “the distance between b and 7 on the number line is 2”? The third question is perhaps a little too complicated to think of in terms of distance, so it would probably be most efficient to rewrite this as two quadratic equations, but multiple representations can still help understanding; sketching a graph can help learners to appreciate why this equation can have up to four solutions.
This progression might give the impression that symbolic (in this case algebraic) representations eventually become dominant, but other representations continue to be useful tools – and are sometimes shrewd choices. For example, when the modulus concept is extended to complex numbers, learners might be asked to sketch on an Argand diagram the set of all complex numbers that satisfy the equation |z – (1+2i)| = 2.  This question might seem intimidating, but it is perhaps less so when it is reframed in terms of distance: “sketch all of the complex numbers which are a distance 2 away from the fixed point 1+2i ”. This gives a big clue as to the shape of the final answer, recalling the archery target.
Probability, Phrasing and Perspective
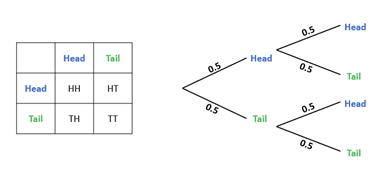
Outside of number and algebra, multiple representations continue to be useful when thinking about probability. What representations come to mind when you think about probability in school? Venn diagrams offer a graphical way to distinguish between the union and the intersection. Possibility spaces and tree diagrams offer two complementary ways of representing combined events, each with its own advantages.
There are many more examples. One of our doctoral students is currently researching classroom language, including the teaching of gradient – a rich topic which can involve many representations. They are discovering how teachers’ choices about language can influence how secondary school learners connect ideas of gradient, slope, speed and velocity.
From spiders to speed then, it pays to consider your perspective. However, teaching multiple representations can take time, and teachers are often required to use their judgement to balance out cognitive costs with expected benefits. We might also ask how learners can learn (and teachers might teach) the skill of judging when to choose and use specific representations. For instance, whilst heuristic approaches such as drawing bar models or using a number line work well in many situations, they do not suit every problem; in some circumstances an adherence to a particular representation-based approach might slow down or frustrate certain learners.
What do you think? Have there been any representations which you remember helping you as a learner or a teacher? Let us know in the comments below.
FURTHER READING
More on Elizabeth Kimber’s work on language and gradient can be found at https://bsrlm.org.uk/wp-content/uploads/2022/08/BSRLM-CP-42-2-05.pdf.
The NCETM (National Centre for Excellence in the Teaching of Mathematics) offers guidance here about some useful representations for teaching mathematics at Key Stage 3 (ages 11-14).