As we reach the end of the RISE project it’s a good time to reflect back on the success of the project. At the start we said that we were going to measure the success in several specific ways (shown in the table below). So how have we done?
| How measured | What success looks like | |
| User response | Survey and informal feedback from students and academics. Analytics data. | Majority of users agree that recommendations are useful and enhanced their use of the search system. Analytics shows positive impact. |
| Take-up of tools and data | Usage of tools and data, downloads of tools and data. | Tools are being downloaded several times a week and there are some comments about the tools. |
| Community feedback | Feedback. | Wider discussions with community about potential of tools & ways to use the data. |
User response
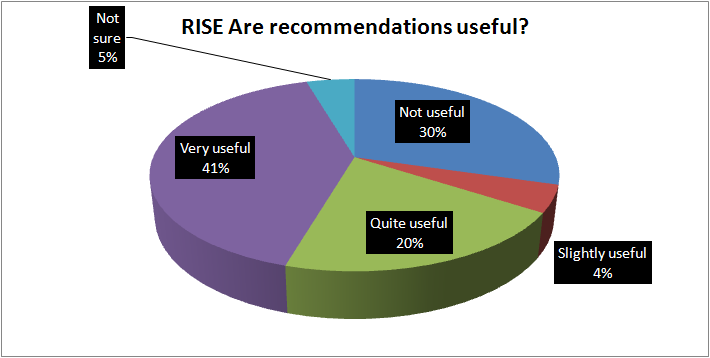
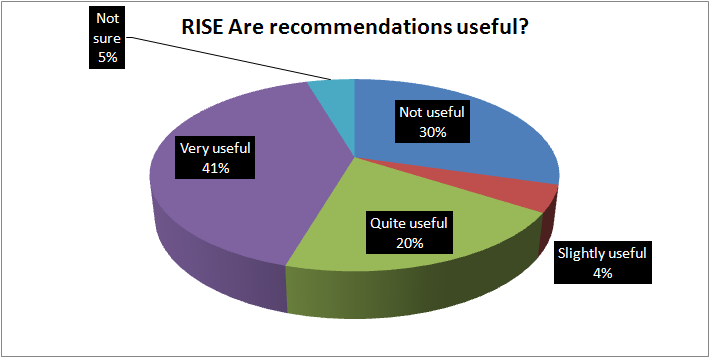
We think this has been amongst the strongest part of the project. So we’ve had engagement with users through a survey and through a series of 1:1 evaluations with users. As you can see from the graph of survey results, the majority of users are finding that recommendations are useful. 
When we asked people about the relevance of the recommendations then we found that a high proportion were relevant (50%) with 31% not relevant. That may reflect that the system had been running for only a short period of time and may benefit from more data.

We’ve setup Google Analytics to be able to track which types of recommendation and which number recommendation is being used. We’ve done some basic work in looking at the analytics data but there is much more that could be done. The data shows that search recommendations are more likely to be used than other types (but the caveat with RISE is that not all recommendations are being shown equally)

Although in comments users have suggested that we show more recommendations, analytics clearly shows that the first two recommendations are much more likely to be viewed than any others.
Take up of tools and data
We haven’t been able to release any data but both the RISE web interface and RISE Google Gadget have been available for a few months. Usage of the tools shows a steady stream of users even though we haven’t done too much promotion of it given the prototype nature. With over 11,000 page views (12% of them through the Gadget) we have reached a good number of users in a short period of time.

Downloads and use of the Gadget hasn’t been so easy to track even though there is a Google Gadget Dashboard. We haven’t however had any comments or ratings by users. We are expecting to publish the Gadget on the OU Gadget directory in the near future so this will drive the uptake of the Gadget significantly.

Community feedback
We’ve had a little over 20 comments on blog posts and some feedback at Activity Data events. We’ve also had 25 people at the Innovations in Activity Data for Academic Libraries event at the Open University in July. RISE was also asked to present at a ‘Subscribed Resources’ workshop that formed part of the SCONUL Shared Services programme.
Overall the RISE project blog has had just under a thousand visits and nearly two thousand page views from users in 32 countries. Much of the traffic is coming via google. The most popular posts/pages have been Innovations in Activity Data, the Technical Resources page and the February project update.

One of the advantages with the Activity Data projects is that we have had the Synthesis project http://www.activitydata.org/ actively working alongside us. We’ve also had to leave until later in the project some of the dissemination activities. But it has seemed difficult to get as much engagement with the wider community as we would have liked.
Overall
We’re happy with the engagement with users, something that is often difficult to achieve bearing in mind that we are a distance-learning instituion. We probably would have hoped for more engagement with the community but many of the people who are working in this area are already pretty busy with other projects on activity data. But overall, within the constraints of a six month project we are reasonably satisfied with what we’ve been able to do.


Pingback: Users | RISE