
Energy Performance Certificates (EPCs) are required whenever homes are sold or let in the UK. The initial aim of EPCs was to provide a simple method for prospective occupants to compare and benchmark the energy and environment impact of homes, and to provide advice on potential improvements. EPCs rank a home’s performance from A (highest) to G (lowest) and are increasingly being used in government policy to attempt to drive and monitor carbon reduction and energy improvements in homes. For example, there are:
- minimum energy efficiency standards (MEES) for rental homes
- targets that all homes should achieve EPC band C by 2035
- funding schemes for homes with poor EPC ratings, contingent upon improvements to the rating.
For existing buildings EPCs are produced based on an assessor conducting a basic survey of a home, combined with assumptions on standard construction types, input into a model known as RdSAP to estimate performance. EPCs use standard occupancy and heating assumptions to estimate energy demand which may be quite different to actual building usage. A lot of research over the years (including some of mine!) has highlighted challenges in the accuracy and usefulness of EPCs and called for reform of the assessment process, models, and recommendations [1-4].
Metrics, Glorious metrics!
But in this blog, I want to talk specifically about the metrics included in EPCs because the Government currently has a consultation on this very topic which closes on the 26th of February [5].
Information designed to inspire action needs to be: comprehensible; relevant to users and the actions it is trying to promote; clearly translatable into action; transparent about where it comes from and what it is based on; and accurate (but we won’t dwell on this one too much as there are wider issues for EPCs here beyond the scope of this blog). Let’s bear these design principles in mind as we look at the two current main metrics on EPCs
Current metrics
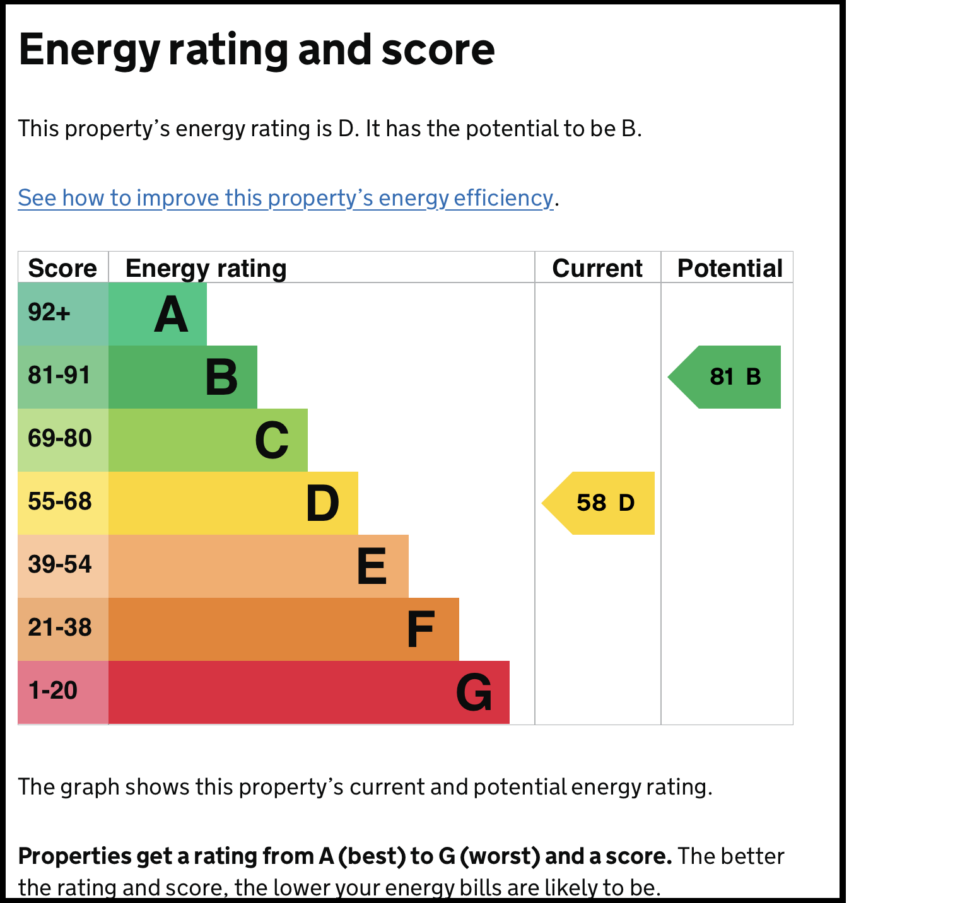
Energy Efficiency Rating (EER)
This rating starts with a measure of energy costs for heating and fixed lighting (but not other energy from appliances, electronics etc) per square meter of building per year.
It is then transformed into a numeric score from 1-100 and then converted to an A to G band. This is several steps away from the performance data and is problematic because, in the words of the UK Climate Change Committee:
‘The A-G bands are not equally sized and the way the ratings are calculated means they do not relate linearly to the attributes they represent. The rating scales are also slightly weighted, and so are not fully independent of dwelling size… it is impossible to convert them to energy consumption per square meter.’ [6]
So, let’s just summarise that, we’ve got a numeric scale which is an amalgamation of some energy demand partially normalised by building area, combined with fuel type and costs, converted to an ordinal scale that isn’t linear, and that can’t be related back to the underlying data. Oh, and it is likely to use energy costs from when the RdSAP values were last updated over five years ago, and despite the title ‘Energy Efficiency Rating’ doesn’t actually have a clear relationship to energy efficiency…
This seems a long way from being comprehensible, relevant, actionable and transparent, never mind accurate! It’s therefore not surprising that research by the likes of Citizens Advice has shown that people don’t really understand or find useful the information provided by EPCs, much less act on it. Some research I did on informational barriers to carbon reduction in 2022 found that of the nine households we interviewed only one mentioned EPCs in the context of information for carbon reduction, and that was only because they needed an EPC as part of a funding requirement [7].
The figure below shows heating demand per square meter against EER rating for 13 case studies from some of my PhD research [3]. As you can see, fuel type determines the ranking, with homes not on mains gas having the worst rankings despite having mix actual energy demand both higher and lower than the gas heated properties.
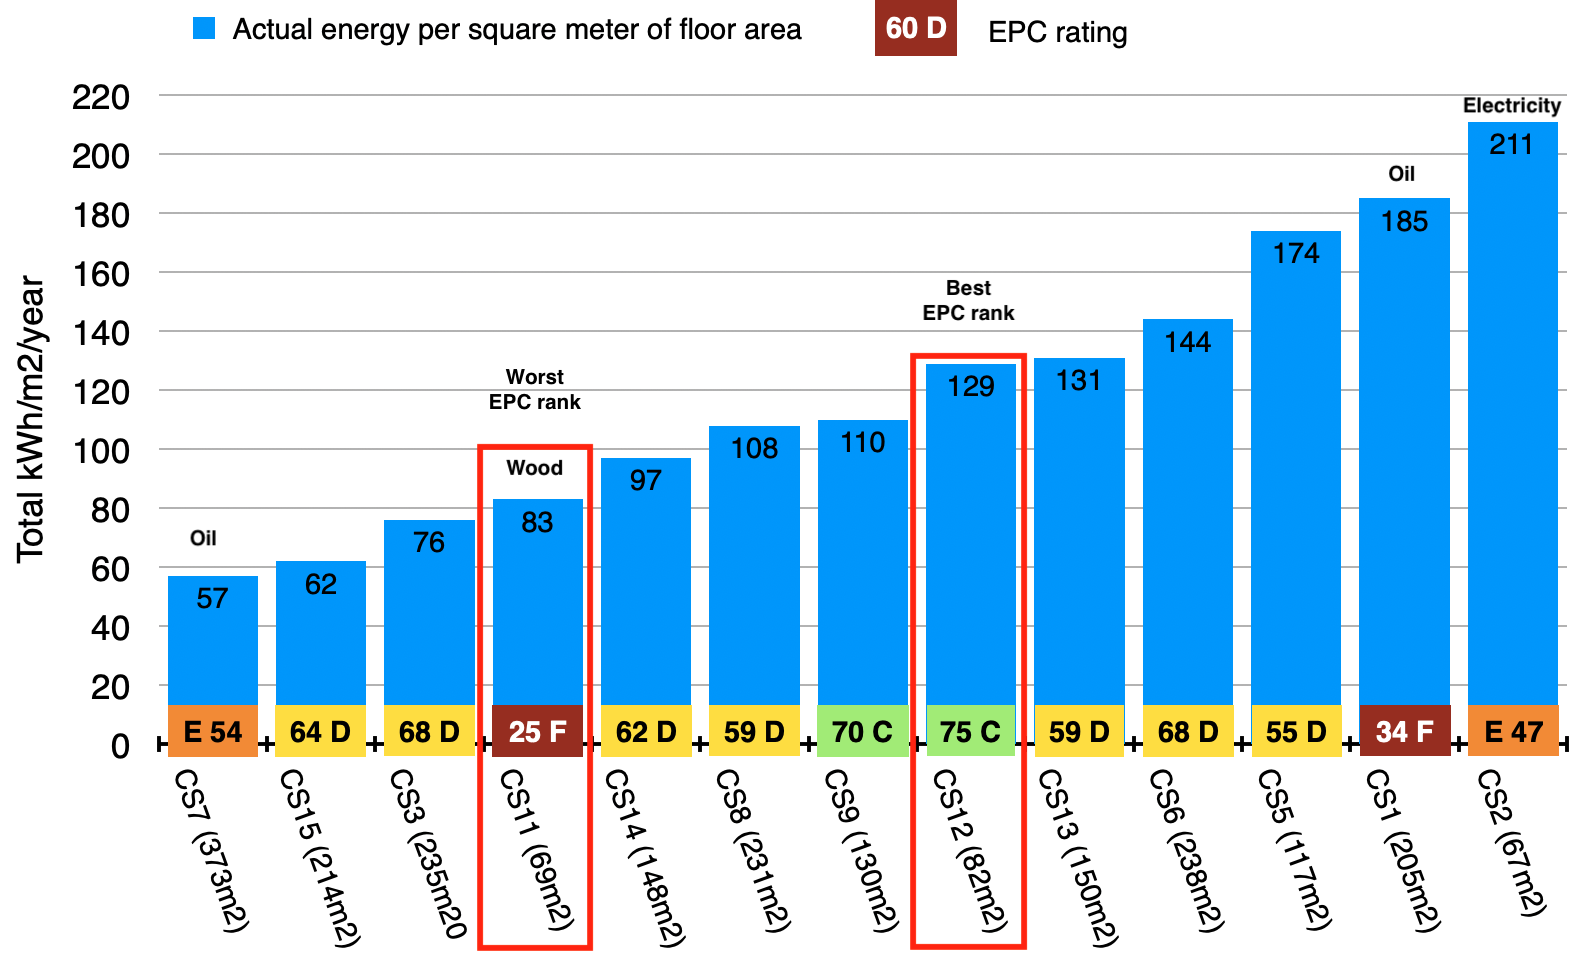
The recommendations for action on EPCs are also predicated on improving the EER ranking and because electricity is more expensive than gas or oil this means that they won’t recommend shifting from fossil fuels to a heat pump. Given that increasing heat pump uptake is a key policy goal to help decarbonise heating and meet our critical climate targets, this disincentive is very unhelpful, to put it mildly.
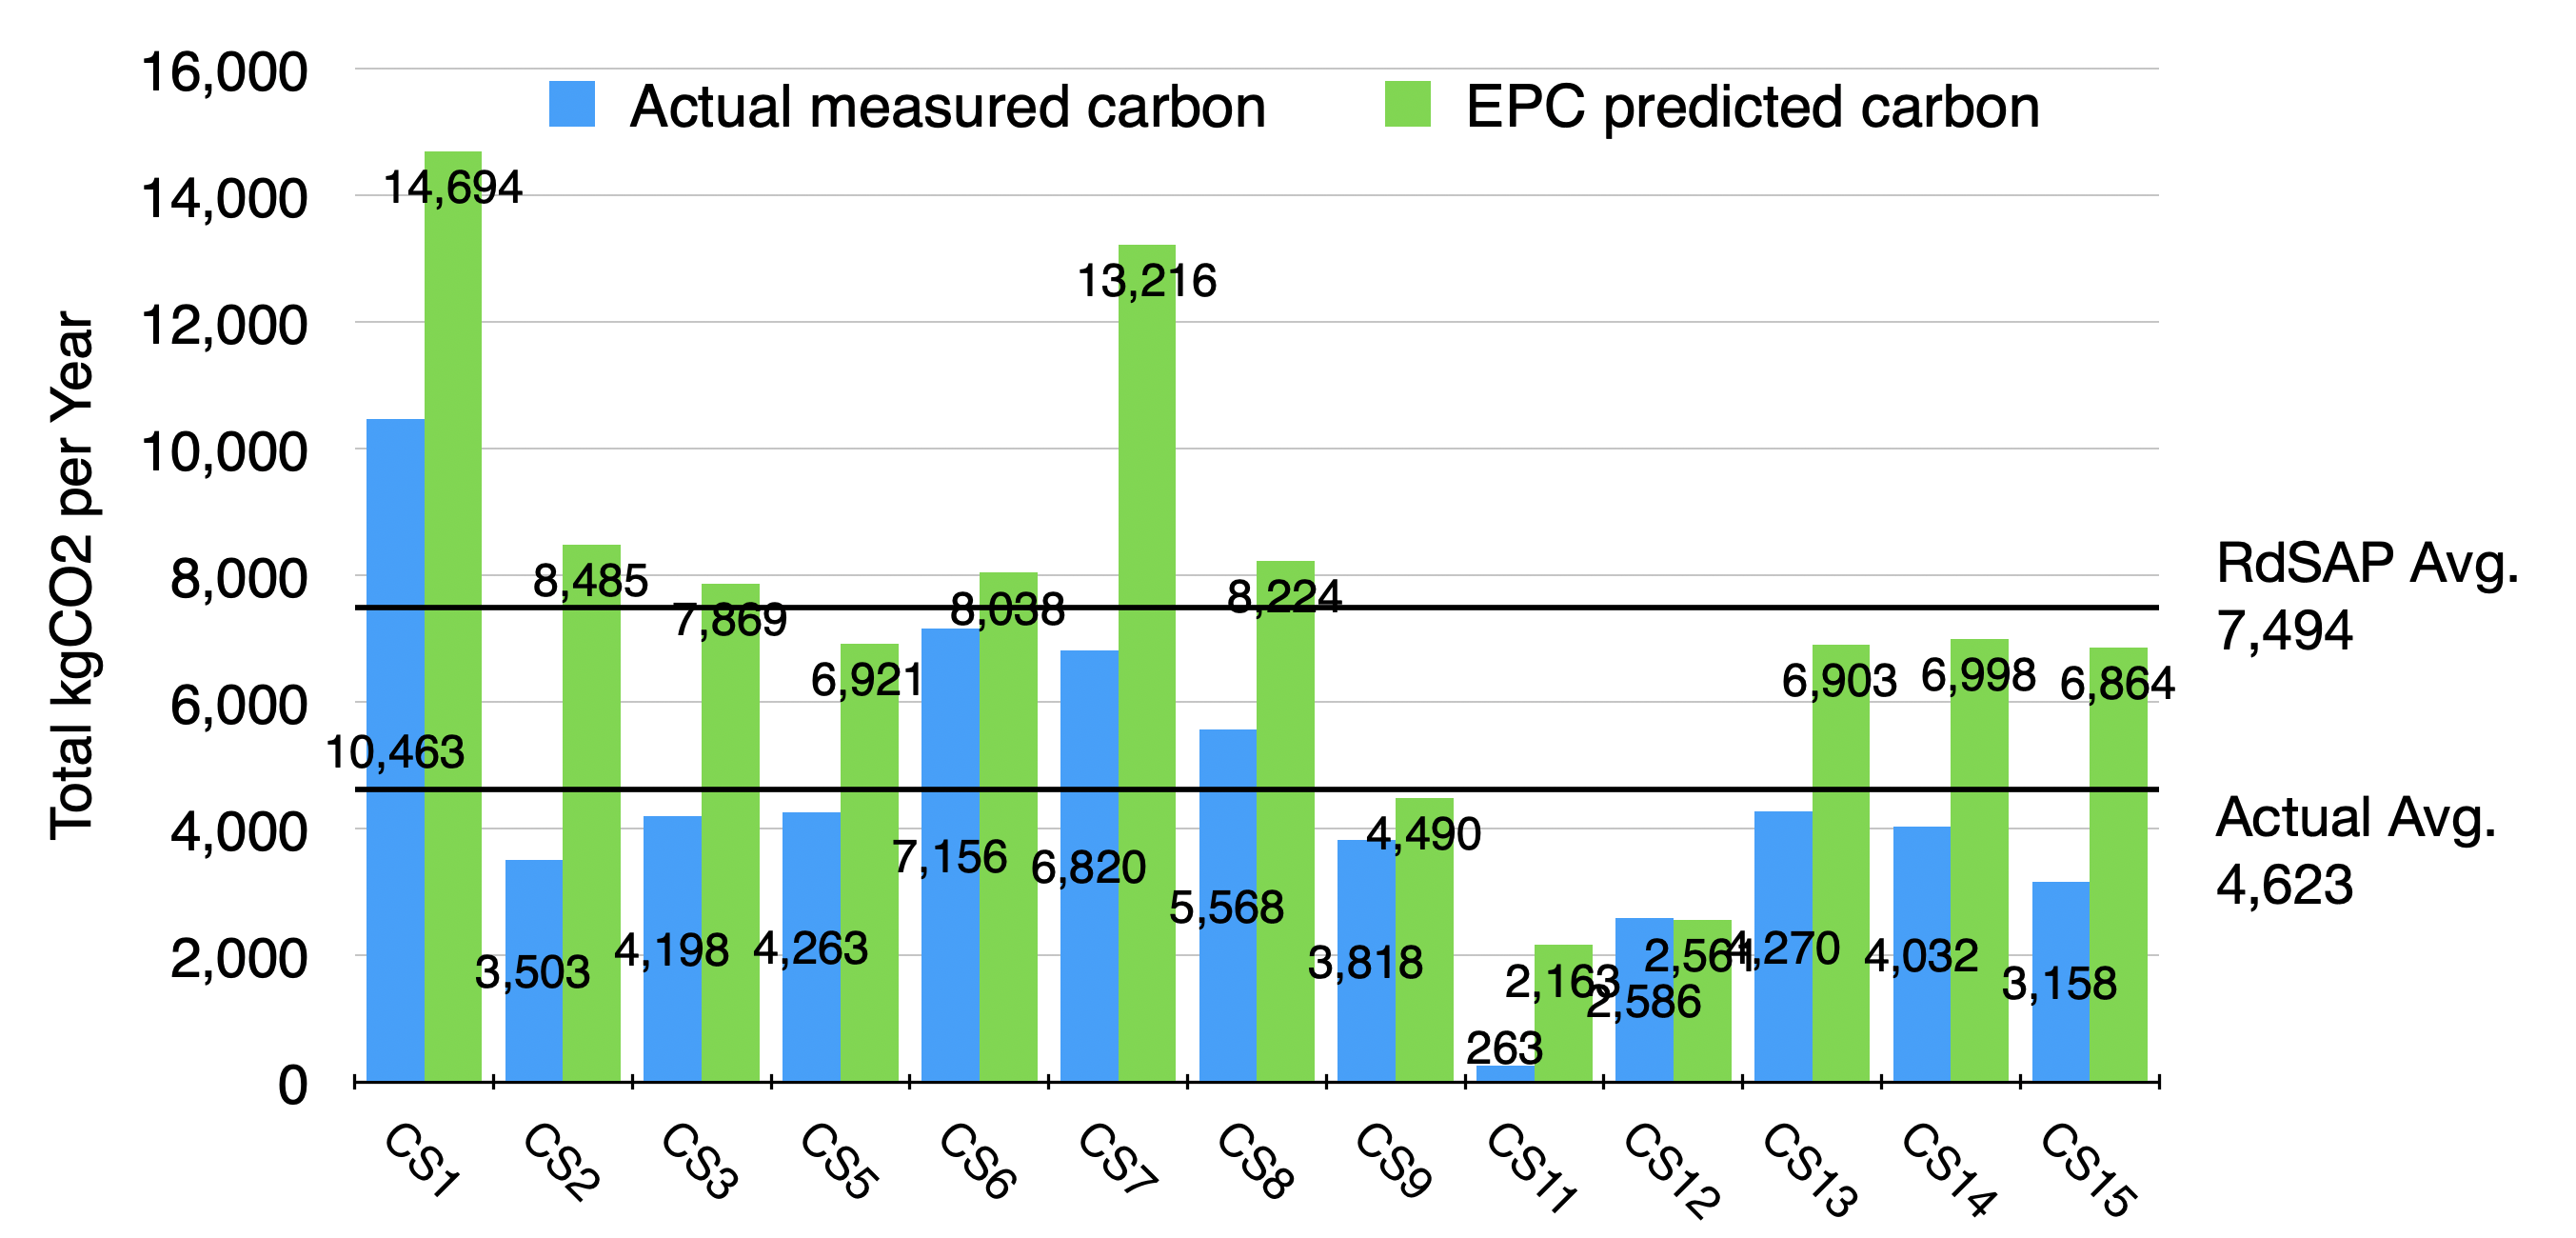
The secondary metric, the Environmental Impact Rating (EIR) measures the carbon emission per m2 per year. This is less problematic than the EER because it is less of a conglomeration. It is also less used in policy goals than the EER so has less scope for unintended consequences and is more comprehensible and transparent. Unfortunately, however it does still suffer from only including heating and lighting energy and the carbon factors for different fuels are not up to date, something particularly important for electricity which is decarbonising rapidly. This led to a 60% average overestimate of carbon emissions by the EPC system for the same case studies shown above, compared to actual emissions.
So, the current metrics and particularly the headline EER don’t seem to be working for anyone and are creating contradictory messages for other carbon reduction policies. Again, quoting the CCC the current metrics:
‘Do not incentive the optimum changes to homes and are opaque and difficult to compare against measured performance’ [6].
EPC statistics are also often used by Government, Local Authorities, financial institutions and others to measure performance against energy and carbon goals and:
‘for these statistics to be useful the ratings need to be valid measures of the desired goals.’ [6].
It’s therefore positive that the government is currently consulting on shifting from the current headline EER metric to a collection of metrics that, combined, will hopefully give a fuller picture of building performance and encourage people to take action.
Proposed metrics
The metrics being consulted on are:
- An energy cost metric: similar to the current EER but hopefully more transparent
- A fabric efficiency metric: to assess the levels of insulation of a building and encourage increased fabric performance. There may be an option for this to be based on monitored rather than predicted performance in the future which would be positive.
- A heating system metric: some form of ranking of different heating systems based on system efficiency and carbon emissions.
- A smart readiness metric: an assessment of whether home can use smart technologies such as systems that automatically use power when the grid has a surplus of renewable energy.
- An energy use metric: considering energy consumption of heating and lighting, etc but still excluding, ‘plug in’ devices and appliances.
- A carbon-based metric: similar to the current EIR but hopefully more regularly update.
The government are proposing fabric, heating system, energy cost and smart readiness as headline metrics, with the energy and carbon metrics provided as secondary information.
So how might this array of metrics perform against our design principles for information to inspire action? I’ve outlined six points below considering how these design principles could be applied with the boundaries of this consultation to improve EPC information presentation.
1. Three times the metrics, three times the confusion?
There is a risk that having multiple metrics increases households’ confusion with EPC information. However, if each individual metric is comprehensible and transparent about what it measures this is likely to be less confusing that the current effort to combine multiple measures into one synthetic number. Having clearer metrics that measure individual aspects is also likely to make them more actionable and make assessing their relevance easier. Below are five examples of some detailed aspects that can could help improve the system.
2. Don’t repeat the mistakes of the past
It is important however that the shift to new metrics doesn’t perpetuate the existing challenges. For example, any scale should use recognisable units that directly relate to the parameter being measured such as kWh (for energy) kgCO2e (for carbon) £ (for energy) etc. This would aid comprehension and allow easier comparison with measured data such as energy bills.
3. Make it clear what the ranking system means
The A to G ranking is likely to be retained because it is a familiar system from other energy efficiency rankings such as those used for domestic appliance efficiency. However, the ranges of each band should be clearly defined using the appropriate real units so that it is clearly relatable back to building performance and so that meaningful comparison between different buildings is possible (which was one of the original goals of the EPC system).
4. Show your working and outline your assumptions
The baseline assumptions that the ratings are based on should also be made clear to aid transparency. For example, EPCs should clearly state the heating behaviour assumptions used (currently 21ºC in the living room and 18ºC through the rest of house for nine hours on weekdays and 16 hours at weekends) so that people can compare this to their own behaviours. There are also calls from various groups for an interactive EPC version including the option to edit these heating assumptions in line with individual behaviours so that certificates are more relevant and more accurately reflect reality.
5. Keep it current
For the cost and carbon metrics the government acknowledge that there are challenges around the timeliness of the data. Energy prices fluctuate over time and the carbon emissions of electricity should continue to reduce. This can mean that the information in EPCs can rapidly become outdated, especially as they are currently valid for 10 years! The government are consulting on reducing the lifespan of EPCs to two or five years to help address this issue. It could also help to clearly state the date when the data is valid for i.e. ‘using energy costs from January 2025’.
6. Make it recognisable
Metrics should use units that people can recognise. So, for example, there is a question in the consultation about whether the energy use metric should use delivered or primary energy. Primary Energy is the energy available as a raw resource before it has been refined into energy that is useable, for example in a power station. Delivered energy is that which is delivered to the building and what appears on energy bills. Currently EPCs use primary energy which is a rather obscure value that households can’t relate to their actual energy usage and bills.
Conclusion
The consultation also suggests better quality training and assessment for the assessors who create EPCs, and we’re promised a consultation later in the year about reforming the underlying modelling system, both of which should help with accuracy issues.
Using good information design principles there are a lot of opportunities to improve current EPCs by using multiple metrics and making them more comprehensive, more relevant, more actionable and more transparent. In summary then, this consultation seems like a positive step forward which should lead to improvements in the presentation of EPC information. However, as always, the devil is in the detail, and we’ll have to see what actions the government takes after the consultation and wait for further reforms to EPC modelling accuracy.
If you want to respond to the consultation, either as a member of the public or an interested person you can find it here: https://consult.communities.gov.uk/energy-performance-of-buildings/consultation-on-reforms-to-epb/ and it is open until the 26th of February.
And if you want you can look up whether your own home has an EPC and see if you find the information useful: https://www.gov.uk/find-energy-certificate
Reference list
- Godefroy, J. et al. (2021) Making SAP and RdSAP 11 fit for Net Zero. Compiled for BEIS and DCLG, p. 176. Available at: https://www.cibse.org/policy-insight/news/making-sap-fit-for-net-zero-new-report.
- Wise, F., Moncaster, A. and Jones, D. (2021) ‘Rethinking retrofit of residential heritage buildings’, Buildings and Cities, 2(1), p. 495. Available at: https://doi.org/10.5334/bc.94.
- Wise, F. (2022) Reducing Carbon while Retaining Heritage: retrofitting approaches for vernacular buildings and their residents. PhD. The Open University. Available at: https://doi.org/10.21954/ou.ro.0001515f (Accessed: 22 December 2022).
- Bartiaux, F. et al. (2014) ‘A practice–theory approach to homeowners’ energy retrofits in four European areas’, Building Research & Information, 42(4), pp. 525–538. Available at: https://doi.org/10.1080/09613218.2014.900253.
- Ministry of Housing Communities and Local Government (2024) https://consult.communities.gov.uk/energy-performance-of-buildings/consultation-on-reforms-to-epb/
- Climate Change Committee (2024) ‘Reform of domestic EPC rating metrics to support delivery of Net Zero’ https://www.theccc.org.uk/wp-content/uploads/2023/02/Annex-Reform-of-domestic-EPC-rating-metrics-to-support-delivery-of-Net-Zero.pdf
- Wise, F., Gillich, A. and Palmer, P. (2025) ‘Retrofit information challenges and potential solutions: Perspectives of households, retrofit professionals and local policy makers in the United Kingdom’, Energy Research & Social Science, 119, p. 103866. Available at: https://doi.org/10.1016/j.erss.2024.103866.
Leave a Reply