Using Course Maps and Profile
One of the OULDI project’s key aspirations is to enable teachers to shift away from a focus on content and subject matter to thinking more holistically and laterally about the design process.
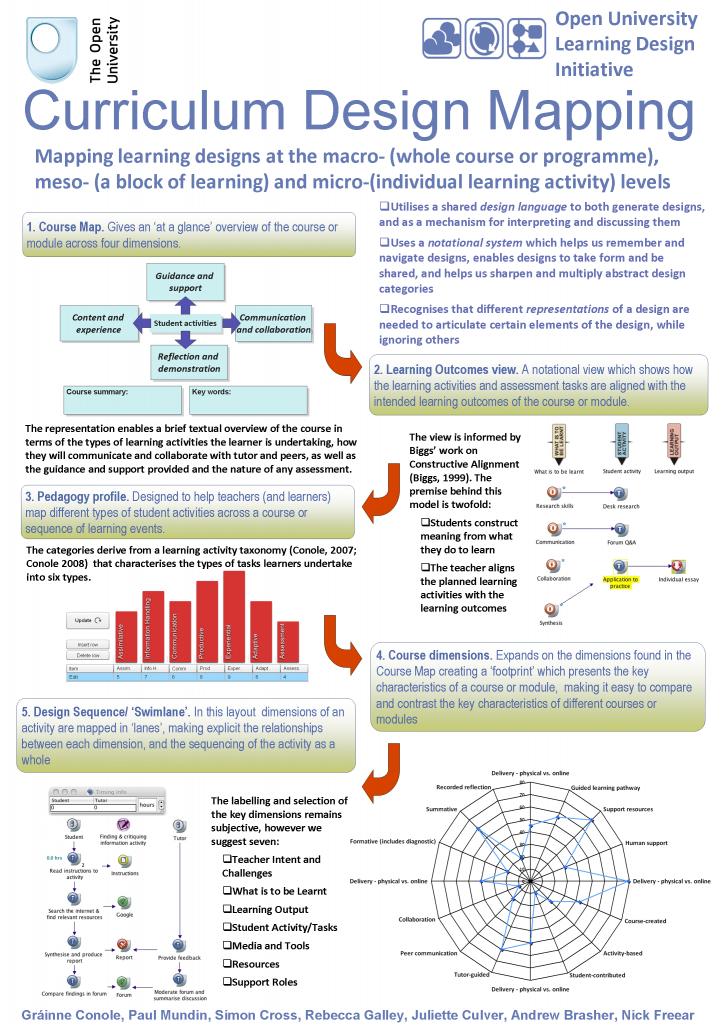
We have trialled and developed several conceptual representations designed to promote thinking and dialogue about different pedagogical approaches and the effective use of technologies:
The Course Map View and Pedagogy Profile View can be achieved through use of the Course Map and Pedagogy Profile tools (see Design Tools & Support section).
The Task Sequence/Swimlane View and Learning Outcomes View can be produced using visualisation software (such as CompendiumLD – see below) or simple diagramming.
The Course Dimensions View is still under development.
These views have been developed whilst working with the Curriculum Business Models Project. In addition, this work has resulted in two data-driven views being produced; one giving an indication of the cost effectiveness of the course, derived from finance data about the course and one giving an indication of the course performance, derived from student and tutor survey data and information on course retention and progression.
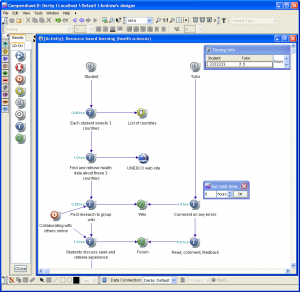
CompendiumLD visualisation software
As part of our work on representing pedagogy we have developed a visualisation tool (CompendiumLD) for designing learning activities. CompendiumLD is a type of mindmapping or concept mapping tool that can be used to design a learning activity. CompendiumLD comes with predefined sets of icons, some generic and some specific to learning design. The creation of a map is simple, users drag icons across and can start to build up relationships between these through connecting arrows.
| LINK to: CompendiumLD: software for creating and designing visual representations of a learning design. Support material includes an introductory sheet and videos, two tutorials and reference sheets. |
Understanding how visualisation can support learning design
Early in the project we reviewed the research we had undertaken during the first phase of the OULDI project (2008) and contributions from key stakeholders noted during a Steering Group meeting early in 2009.
A number of benefits in using visualisation can be identified:
- Making the structure and relationships explicit
- Supporting reflection on the learning design and in particular the student experience
- Testing how realisable and practical the design is
- A diagnostic tool for the evaluation and annotation of a design
- Collaboration and communication of ideas
- Organising thoughts, including mind-mapping and brainstorming
- Sharing the visual design or ‘learning plan’ with students
- Supporting the teaching of the course: A tool for associate lecturers
- Capturing the process of design in addition to the final output (forming a record of discussion and development)
- Supporting the delivery of change in practice
- Express information, concepts or relationships in the form that is most easily absorbed and retained (e.g.,shape of a graph)
During 2009 and 2010 we undertook a number of activities to further test and develop our understanding of these benefits and explore practical applications. This included a review of earlier work on learning design, beginning with Oliver and Hetherington’s (2001) proposed three critical elements of learning design environments’ – learning task, learning resources and learning supports. Whilst they chose to represent these on a diagram by a basic notational system of rectangles, triangles, others, as the previous chapter outlined, have chosen other formats and presentational styles.
The question of how to notate learning designs remains one important and unresolved question:
Not only have researchers sought to develop visual notations of designs within their discipline, they have looked beyond it too. For example, Water and Gibbons (2004) look to dance notation, James Diezel to musical notation (Conference Keynote Address, LAMS 2009) and Prior (2007) to art and aesthetic experience. The example of notation indicates how important it is that learning design pays close attention to work on design undertaken in the instruction design field (Gagne et al. 1992, Merriënboer, 2002, Botturi 2006) and in development of techniques, and associated tools, for visualisation (Buzan 1998, Novak and Cañas 2008).
Gibbons and Brewer (2005) identify several benefits to developing good notation and these broadly map to some key themes for our work. The first benefit they propose is for remembering designs and creating a culture based on good practice. This is of course important for later reuse and redesign for without documentation of more than just the learning materials produced, how can the designers intentions be communicated and substitution of component parts be successfully achieved (Stobel et al. 2009). The second is that notation provides a structured problem-solving workspace. The role of problem solving has been explored in design disciplines (for example, Koktovich 2009, Ambrose and Harris, 2010) as well as in teaching (Jonassen and Hernandez-Serrano, 2002). It is important to recognise that challenges associated with learning ‘design’ may well be similar to those confronted by designers in other design fields and cultures. The third benefit of good notation identified by Gibbons and Brewer is for fostering communication and community, and Cloudworks is an example of our work on building a tool to promote online learning design communities. The final benefit is for ‘creating a laboratory for the sharpening of designs and expressing and assessing design decisions’. Cross, S. (2009) The Learning Design Initiative Institutional Project Phase Two Report
Following the themes identified by Gibbons and Brewer in relation to notation and others in respect to broad forms of representing and imagining designs our work seeks to consider and explore the many possible roles of visualisation. In particular how much value it may offer in supporting problem solving, recording the process, evaluating designs and communicating and reusing with others. For further information, see the Publications sections of this website.

