
Here is a diagram taken from a recent article in Journal of Cleaner Production which will be familiar with some readers. Are such diagrams useful in designing?
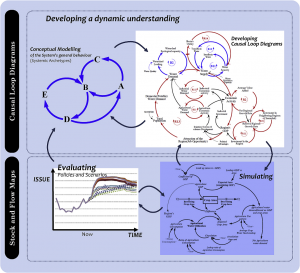
Ehsan N et al 2017 Boundary matters: the potential of system dynamics to support sustainability? Journal of Cleaner Production, 140(1) 312-323
I am not talking about sketches of things (analogical and schematic diagrams), rather about symbolic and conceptual diagrams. Symbolic diagrams in science can be powerful such as those that Roger Penrose has used for complex tensor equations (https://en.wikipedia.org/wiki/Penrose_graphical_notation) or Richard Feynman (https://en.wikipedia.org/wiki/Feynman_diagram) for behaviours of subatomic particles. I am mainly talking about conceptual diagrams which display (hyper)networks and lattices of connected concepts (with associated labels and flows). Connections can also be represented as overlapping bounded regions representing the concepts.
What does the conceptual diagram show over and above a textual description? It puts all the bits ‘on the table’ together rather than in the accumulative mode of an unfolding textual description. However, a common request in a presentation or design meeting is to ‘talk through’ a diagram. This talking through unpicks a diagram into text from which it can be reassembled and meaning assigned. The diagram seems a dynamic tool matched nicely to participatory modes of design. Why impose, or even suggest a diagram. Perhaps participants should be (re)constructing their own diagrams.
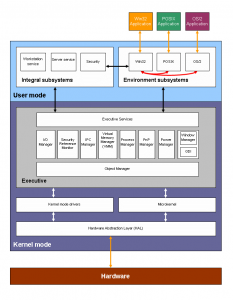
Can diagrams get in the way of progressing a design? Can they lock down connections and overlaps? I recall that Christopher Alexander pivots his argument in Notes on the Synthesis of From (Alexander C, Harvard, 1964) on diagrams as the bridge from requirements (function) to form. This is a bit different from the pattern language of his subsequent work. Historically, this insight turned out to be especially relevant for the disciplines of computer science and software engineering. Alexander’s book is probably more often seen on software engineers’ bookshelves than designers. Might these diagrams actually get in the way of synthesis particularly in the more concrete and spatial domains of architecture and engineering? Here is a software block diagram for an historic Windows 2000 operating system https://en.wikipedia.org/wiki/Block_diagram
Diagrams are an individual and personal way to interpret hierarchies and connections rather than an embodiment of truth. Participants in a design task create disparate diagrams to illustrate and communicate their design thinking. This process of creating diagrams fluidly seems a key part of community design and communities who design.
Leave a Reply