Rebecca Would is a year 12 work experience student who has visited the Maths and Stats department of the OU. She interviewed Karen Vines, a senior lecturer in statistics, to find out about her and her work
Maths and Stats students at the OU will have studied with Karen on modules such as M346 and M140. She also wrote one of the M249 Practical Statistical Modelling books.
This is Rebecca’s report:
Let’s start with my favourite opening question: What is your favourite vegetable?
Karen: Avocado, or carrot.*
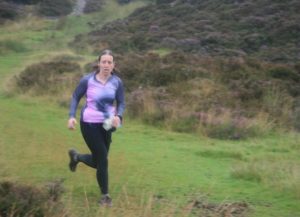
Karen in Orienteering mode
Are there any particular bits of stats that are of interest to you?
I’m reasonably eclectic. There are many different areas and I’ve moved around a bit, I haven’t really got a main focus. Possibly the most fun has been what’s known as sonification, turning graphs into sound.
How do you do that?
Usually you start with a scatter plot or line graph, then equate pitches with the numbers, and each graph produces its own unique tune. [There is a 5-minute video about this project here].
I like to think as a statistician I have more fun than a lot of my colleagues, as I really can pick and choose, there’s data on everything. And it’s nice to know that if I were to leave I’d be able to find somewhere, everyone needs a statistician – I’m not going anywhere, but it’s good to know the option is there.
How do you get to be a statistician at the OU?
Mostly by accident. My career planning stopped at age 21: go to uni, get a degree. I did maths but no stats in my degree, unfortunately in first year no stats was offered, so when I started to become interested in second year I was told I couldn’t as I didn’t have the background. When I got to the end of my degree, I briefly flirted with the idea of becoming an actuary, and was completely put off when I went for an interview and someone said, “Now I’m more senior I get to play on the stock market!”. Then I thought about doing an MSc in statistics or operational research, and having done operational research in my degree, I chose to do statistics. After that I was fed up of being on the education treadmill, and so went to work as a practicing statistician at a medical research place (MRC Environmental Epidemiology Unit). There was a good mix of medics and statisticians and I got to learn a lot off my senior colleagues. They were doing a lot of fun things, some less fun things, but a lot of fun things. I stayed there for almost 2 years, by which point I decided that yes I did want to do a PhD.
What was the biggest difference between doing a masters in stats and an actual job, if there was much of one?
I think there was, yes. In a masters you could do this, you could do that, you could do a regression line, I could do a T-test… but it’s knowing what to do when someone comes along saying “here’s some data.” It’s a skill certainly, and one I hope I’ve picked up.
After that I knew I wanted to move, so applied to the OU and got in as a statistical advisor, with the intention of staying 1/2 years. Stuff happens, and here I am.
Having started with the aim of 1/2 years, how long have you been here?
23. And a half.
After this Karen and I talked a lot more about university and how it has changed over the years. It was really interesting talking to her, and she has a true enjoyment for everything. I’ll take away from this the drive to keep researching more, and her love of stats.
Thanks to Rebecca for writing this and Karen for taking part.
*Cathy comments here as a frivolous editor that we can say that Mathematics deals with certainty, while Statistics deals with uncertainty: Karen shows she is a true statistician in replying to a ‘what’ question with an ‘or’ answer.