Jenika Patel
This summer I took part in the Nuffield Research Bursary scheme at the Open University where I participated in a four week project researching the Indian monsoon. My main aim was to see how terrestrial proxies (pollen and charcoal) could be used to understand the evolution of the monsoon from 3.5 million years ago.
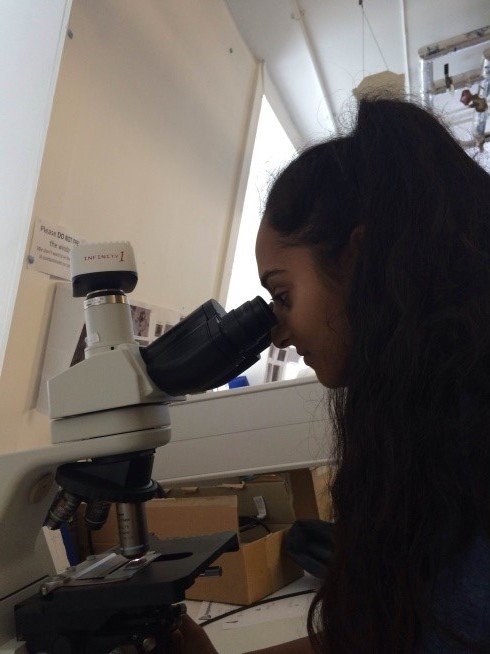
On the first day I prepared some of the slides that I would be looking at under a microscope later on in the project. I was really excited to see the pollen on the slide so I took a quick look, but under the microscope all I saw was a huge mess!
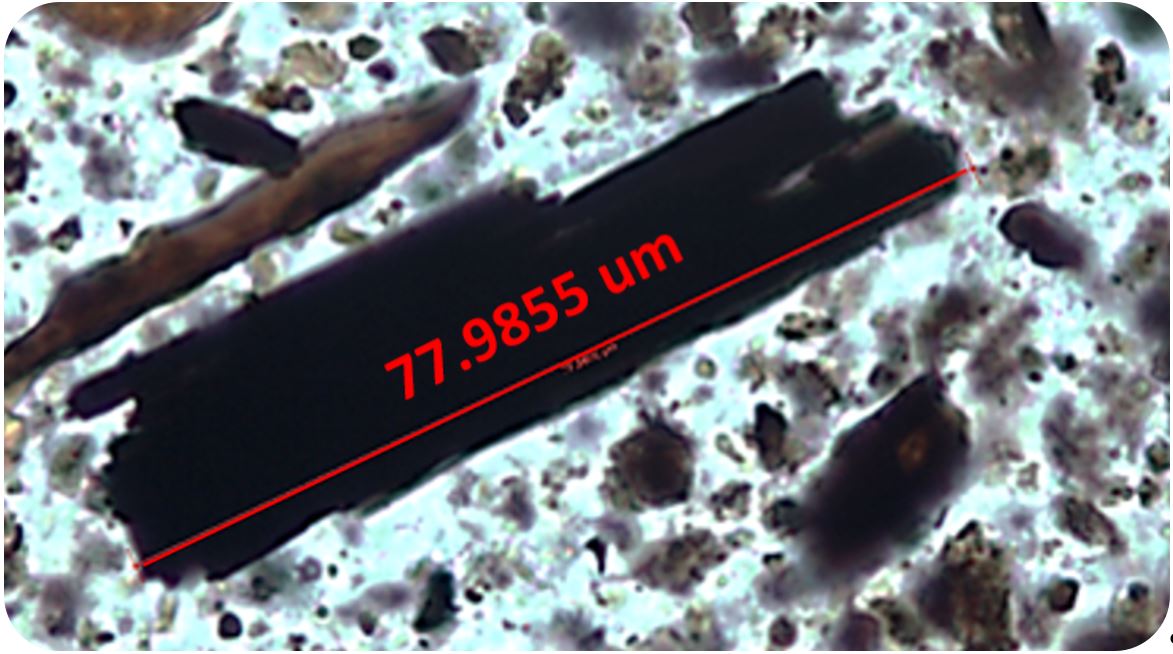
Charcoal under the microscope. Credit: Jenika Patel.
I had never seen pollen under a microscope before so I didn’t really understand what I was looking at. This intimidated me a little so I put them to the side and began with something a little easier.
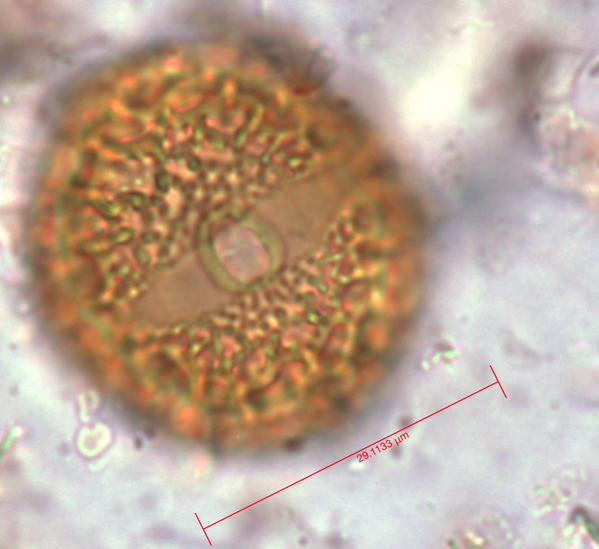
A pollen grain. Credit: Adele Julier.
The macro charcoal was fairly easy to count, I had to look for dark, opaque rectangles or clumps, and I used a Bogorov counting chamber which helped with counting. These samples hadn’t been treated with as many acids as the pollen samples, so I found some really interesting forams.
After all of the macro charcoal was counted I returned to the pollen. Before I looked at my samples I looked at some slides with only one type of pollen so I could become more familiar with the shape and size. The different types of pollen varied significantly. However, a few characteristics were similar, which helped me to recognise them.
Pallavi Anand, The Open University, one of my project supervisors.
It was really exciting to be given the opportunity to use technology that allowed me to take pictures of my slide under a microscope. After I felt confident enough with recognising pollen I began to count the pollen, charcoal, fungal spores and marker spores on my slide. At first it was difficult as the slides were so crowded but it got easier to recognise the substances that I needed.
After I had finished counting I converted the data into meaningful numbers and I learnt how to plot graphs using software called Kgraph. As I wasn’t sure what to expect, the graphs didn’t really make sense.
I read books and reports about monsoons to help with the background knowledge but I also needed a lot of assistance from specialists at the university to really help to understand the data. It was really interesting to hear different thoughts of what the data showed. I then wrote my report and began my poster; this was a challenge as it was difficult to fit all of my ideas into a few bullet points.
Hayley Keen, The Open University, one of my project supervisors
Through this project I have learnt many new skills and techniques which will benefit me in the future, it has also made me realise the significance of studying past monsoons. I would like to thank everyone at the OU, especially Pallavi Anand and Hayley Keen as without them I would not have been able to do this project.
I would also like to thank the other students who were working in the same lab for making the four weeks enjoyable. This Nuffield Research Bursary project was a great experience and I enjoyed every moment!