
Zaibaa Mehmood, Luton Sixth Form College.
During my summer holidays, after my first year at college, I took part in a Nuffield research placement at the School of Environment, Earth and Ecosystem Sciences (EEES) at the Open University.
During this placement, I worked alongside a PhD student Sophie Alexander to analyse marine sediment (or mud in simple terms).
The main aim was to investigate surface ocean productivity in the Southern and Atlantic Ocean during the early Eocene. This was broken down for me into smaller aims as below:
- Create smear slides of mud samples from different sites
- Identify components on slides using a polarising microscope
- Compare analysis of 3 different sites and decide what changes there are and how they were caused
- Use the data gained to improve knowledge of ocean productivity during a warm greenhouse period.
In my first two weeks at the EEES, I learnt and made smear slides of marine sediments from 2 different sites in the Atlantic Ocean. I also did some background reading to gain an insight into the work I was going to do. Site 1258 is along the equator and Site 690 is near Antarctica (as shown on the map below).
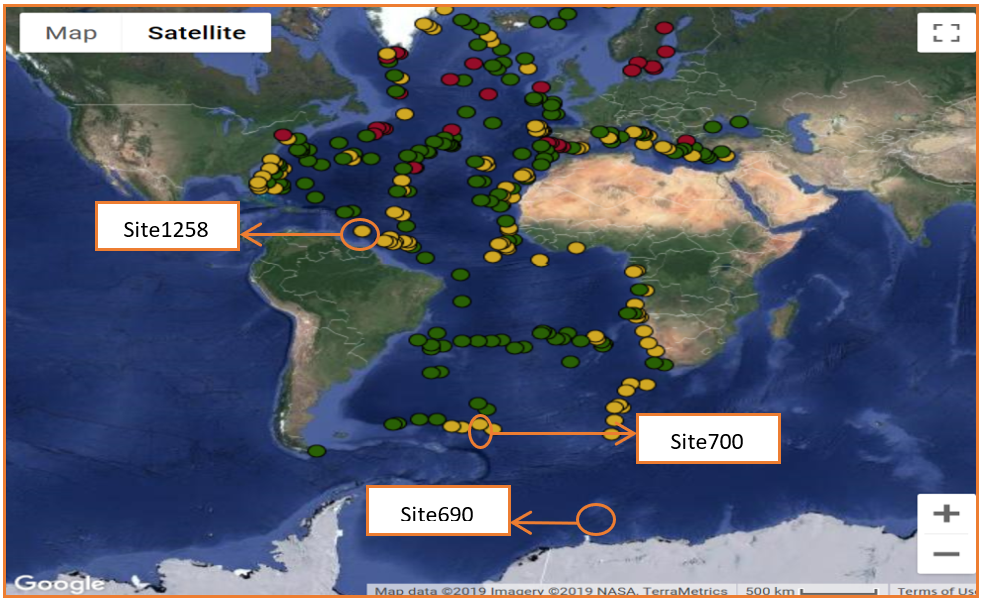
A map of the world, showing Sites 1258 and 690.
So you must be looking at this map and thinking what is Site 700? Well, after I’d prepared the slides for Site 1258 and 690, I used a polarising microscope to analyse them and to see what components they contained.
Obviously, I had no clue what I was looking for at first, but then Sophie showed me pictures of the different types of components I was to look for. So using these pictures, I began my journey of analysing 34 slides under the microscope.
Site 1258 was great, I saw many different components in many different ratios but then… I got to Site 690. I was surprised because every single slide that I looked at, just looked so similar. I later discovered that this was due to the change in location and Site 690 was dominated by a component called Coccolith, which is a type of nannofossil. That was the reason why the slides all looked so similar. So, this is where Site 700 comes in.
Site 700, as you can see on the map, is in between Site 1258 and Site 690. So we decided that I should look at Site 700 to found out what was happening over there. Site 700, as expected, was a mixture of the other two sites. It had a lot more variety than Site 690 but coccoliths were still the dominant component.
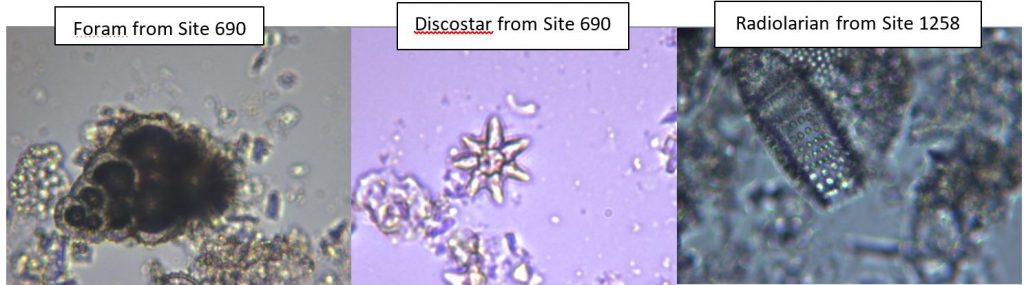
Foram from Site 690; Discostar from Site 690; Radiolarian from Site 1258.
In the next couple of weeks, I started making myself familiar with Microsoft Excel as this is where all my data was put into. Calculating percentages into an allocated slot were easy but the work of a PhD student is never easy. Sophie asked me to make graphs for the data at each of the three sites, I sat at the computer looking at all the tool buttons, but after half an hour or so I decided to ask Sophie for help. So now I know how to make graphs using excel – great! But then again, disaster strikes.
I had completed my 6 graphs (2 for each site; 1 for the data I recorded and 1 for the shipboard data when the samples were initially drilled out of the ocean), but now my next problem took me back to primary school. I was pretty sure that percentages should add up to 100%, but for some mysterious reason, my graphs were way over. Apparently, excel does not like two sets of data in one sheet. So after some rearranging, I fixed my graphs in time for the Paleo research group meeting to talk about what I have been up to.
The Paleo Research Group meeting is held fortnightly. It is the place where everyone in the group gets together to talk about their work and findings. They also use this opportunity to prepare for any talks or presentations they have upcoming. In the meeting, I told everyone what I was doing and presented to them the results. As expected, there were a lot of questions. (Time to deploy my communication skills!)
Honestly, this experience was so amazing. I learnt so much in just 5 weeks. Not all that I learnt is geology related, and the best thing about that is that some of the skills I’ve learnt are so useful in any degree or career. Even so, the geological knowledge I have gained has really interested me and has made me question more about the little things we do and how much of an impact they have. It’s phenomenal!!!
But I couldn’t have done it without the support of Sophie Alexander and Dr Pallavi Anand (project providers) and the opportunity and funding from Nuffield Foundation.