Black History Month – Celebrating Black Excellence in Mathematics 

October is Black History Month. This year the theme is “Standing Firm in Power and Pride”, honouring the resilience, leadership, and cultural identity of Black communities while marking key anniversaries such as 60 years since the Race Relations Act and the death of Malcolm X.  

Black History Month banner.

Black History Month.

Mathematics and Statistics are often thought of as neutral or objective subjects, but the way we teach, learn, and engage with them is shaped by our experiences, cultures, and opportunities. The act of doing mathematics is a human activity that is universal, shared, and also deeply personal. 

We recognise the limitations of our mathematics and statistics curriculum, which draws on mathematical ideas from across the globe, but is rooted in Eurocentric traditions. As we celebrate Black History Month, it is important to spotlight the extraordinary contributions of Black mathematicians: those individuals whose brilliance and perseverance have shaped not only the field of mathematics but also the course of history. 

One such trailblazer is Katherine Johnson, whose story reminds us that mathematics is not just about numbers, it’s about courage, precision, and breaking barriers. 

Katherine Johnson: The Mathematician Who Sent Us to the Moon 

Katherine Johnson working at a desk at NASA in 1966.

Katherine Johnson working at NASA in 1966.

 (Photo credit: NASA)  

Katherine Johnson (1918–2020) was a pioneering NASA mathematician whose calculations were critical to the success of major space missions. She performed trajectory analysis for Alan Shepard’s 1961 flight, the first American in space, and famously verified the computer-generated calculations for John Glenn’s 1962 orbital flight at Glenn’s personal request. Her work also contributed to the Apollo 11 Moon landing in 1969.  

Johnson’s career spanned over three decades at NASA, where she broke racial and gender barriers in a segregated America. Her story, along with those of Dorothy Vaughan and Mary Jackson, was popularized in the book and film Hidden Figures, bringing long-overdue recognition to the Black women who helped launch the space age.  

Her legacy is not just in the missions she helped succeed, but in the inspiration she provided to generations of students, especially young Black girls, who saw in her a reflection of their own potential. 

Read more about Katherine on Open Learn here: Katherine Johnson: NASA mathematician and much-needed role model | OpenLearn – Open University 

Dr Nira Chamberlain: Modelling the Future of Mathematics 
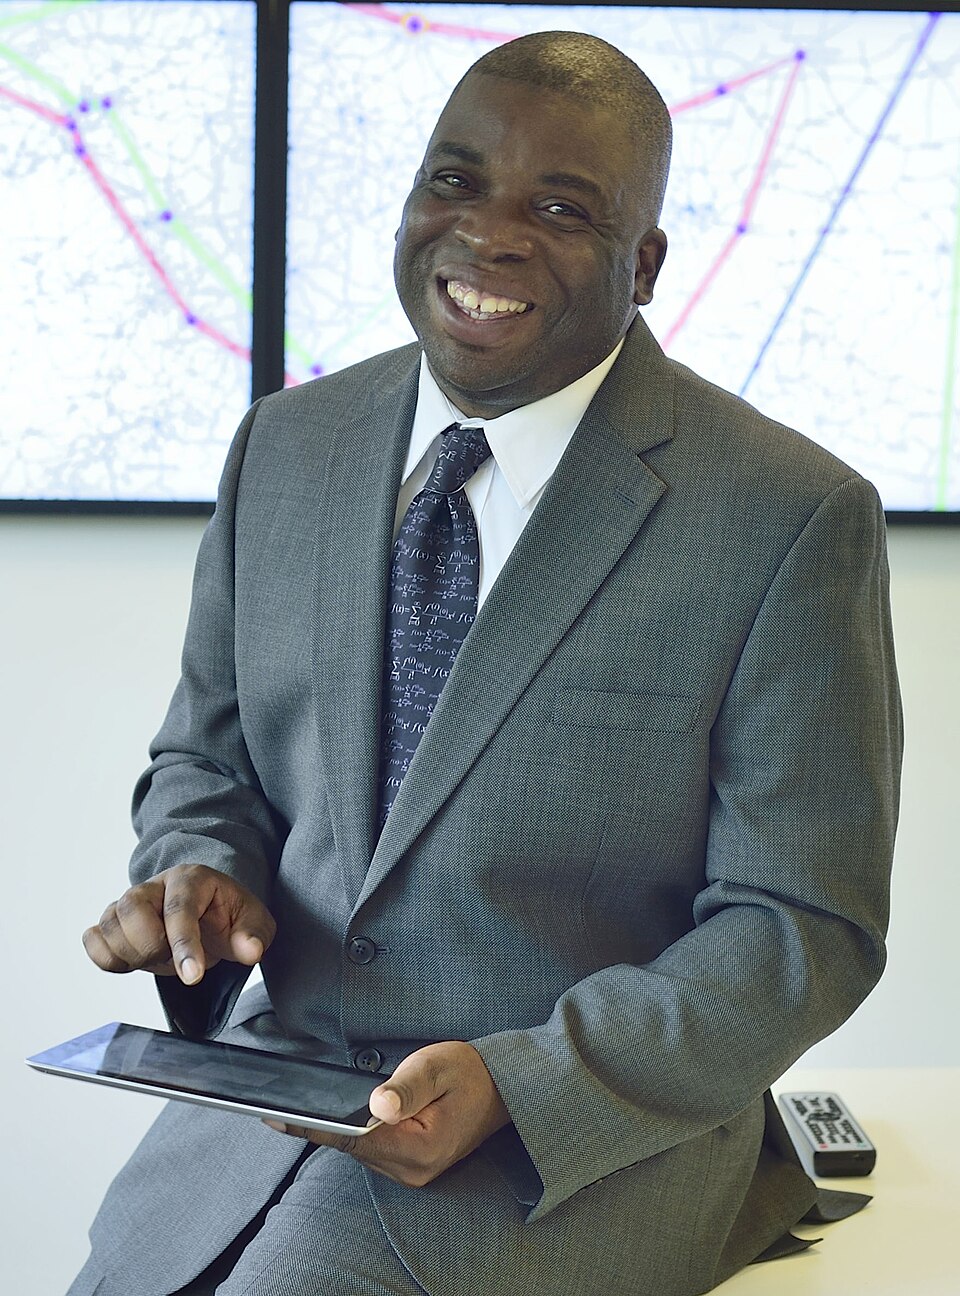
Nira Chamberlain sitting on a desk holding an ipad.

Professor Nira Chamberlain OBE

(Photo credit: Nira Chamberlain)

While Katherine Johnson’s legacy reminds us of the power of mathematics to break barriers and reach new frontiers, today we continue to see that same brilliance in mathematicians like Dr Nira Chamberlain, a leading figure in British mathematics. 

Dr Chamberlain is an award-winning mathematician known for applying complex mathematical modelling to real-world problems, from predicting the lifetime costs of naval ships to solving industrial challenges across Europe and Africa. He holds a PhD in mathematical modelling and was named one of the UK’s top scientists by the Science Council. In 2020, he became President of the Institute of Mathematics and its Applications. Beyond his technical achievements, Dr Chamberlain is a passionate advocate for diversity in STEM, regularly speaking to young people about the power of mathematics and the importance of representation. 

Read more about Nira’s work here: Professor Nira Chamberlain OBE CMATH FIMA CSc – Professional Mathematician

A legacy of Black excellence in mathematics  

While Katherine Johnson and Dr Nira Chamberlain offer powerful examples of Black excellence in mathematics from the past and present, they are part of a much wider legacy. From Benjamin Banneker, who predicted solar eclipses in the 18th century, to David Blackwell, a pioneer in statistics and game theory whose work led to the Rao-Blackwell theorem, Black mathematicians have made profound contributions across centuries and continents. 

In the UK, figures like Francis Williams, a pioneering mathematics scholar in the 18th century who taught mathematics, and Dr Maggie Aderin-Pocock, a space scientist and science communicator who uses mathematical modelling in her work today and inspires young people through outreach and media, show how mathematical thinking continues to shape our understanding of the world. 

This Black History Month, I invite you to explore these stories further. Whether you are an educator, student, or simply curious, take time to discover the lives and legacies of Black mathematicians whose work deserves to be known, celebrated, and taught. 

An excellent place to start at would be The Open University Black STEM hub: created by and for Black STEM students  as a dedicated space by and for  Black STEM students. You can find out more about the students and staff involved here: Black STEM Hub | Faculty of Science, Technology, Engineering & Mathematics

a light bulb which says: OU Black STEM HUB, surrounded by two hands.

OU Black STEM hub

Resources and further reading  

Text saying: "Race and ethnicity hub" in a pink box on top of a colourful map of the world showing Africa and South America.

Race and Ethnicity Hub


Posted in Uncategorised | Leave a comment

Desert island mathematics – counting coconuts

The Level 3 mathematics education modules at the Open University develop certain ideas (module ideas and frameworks) that can help us notice, structure and reflect on mathematical thinking. I’ll be using some of these to analyse my work on a puzzle from the Maths and Stats (M&S) student newsletter, Open Interval.

The joy in mathematics is in the doing, so do have a go yourself first!


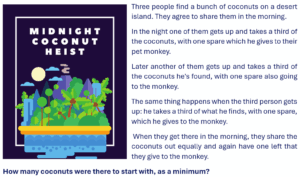
FIGURE 1: The puzzle

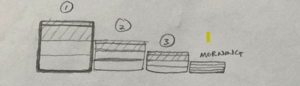
I am particularly interested in the use of diagrams, so rather than jump into using numbers or x’s and y’s, I started with a ‘bar model’.


FIGURE 2: Coconuts as bars. Bounty?

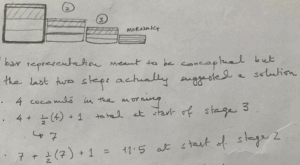
While the bars were intended to be conceptual, the last two stages suggested a numerical solution: that they found 4 coconuts in the morning. I worked backwards from the 4 but it led to there being 11.5 coconuts at stage 2 ☹


FIGURE 3: Problem with fractions!

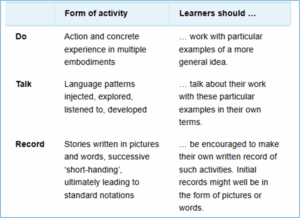
I’ll take a pause from sharing my mathematical work, and introduce one of our frameworks, Do – Talk – Record, covered in ME620 Mathematical Thinking in Schools.


FIGURE 4: DO TALK RECORD summary

While Do – Talk – Record (DTR) is presented sequentially, things aren’t that clear cut! The very act of doing with pencil and paper involves writing (recording) and the talking can be silent talking to myself or thinking aloud. Indeed, some of the writing in my work is my internal talk being made explicit. As doing, talking and recording are inextricably intertwined, the framework is meant to focus on the emphasis or intent at a particular stage, rather than divide activity up into separate boxes of Do, Talk, or Record.


FIGURE 5: Some later stages of recording

Indeed, having worked with it before, the DTR framework now prompts me to take stock when working on a problem, making explicit any emerging ideas.

There is another module idea that has an overlapping cyclical approach, Manipulate – Get a sense of – Articulate (MGA) covered in ME620 and in ME322 Learning and Doing Algebra. I manipulate my various representations of the number of coconuts at each stage, to get a sense of the mathematical relationships involved, which then helps me articulate better representations, which now become available for a further round of MGA.

The 11.5 coconuts (Figure 3) made me realise the puzzle may not be as easy I had initially thought. As fractional coconuts didn’t seem in the spirit of the puzzle, I would need to ensure that the numbers at each stage were positive integers. Such problems have a particular name, Diophantine problems, and can be notoriously difficult. So I decided some algebraic stock-taking may be helpful to ground further numerical work (trial and improvement?).

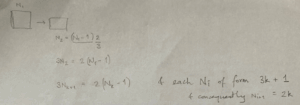
An early formal observation was that at each stage there would be 3k+1 coconuts for some positive integer k. Furthermore, other than the first stage, each subsequent stage would also need to have an even number of coconuts, 2k, the leftover once one share and one coconut (k+1) had been taken from the 3k+1.

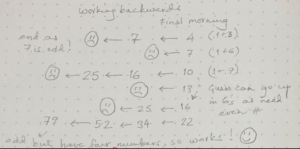
Working backwards from a ‘final’ possibility such as 4 or 10 seemed less daunting than proceeding with solving recursive equations of the form N_2 = 2/3 (N_1 – 1) 🤪


FIGURE 6: Working backwards from 4, 7, 10, …

I had my first solution! I was convinced 79 was the smallest possible solution, so I was done. But that seemed quite unsatisfying. What more could I say or do? This leads me to Noticing Structure (in ME322), the final module idea I would like to share here. Join one of our modules to explore others! 😊

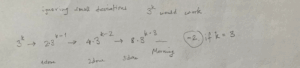
Ignoring the monkey’s singleton share, I need numbers that are continually divisible by 3; why have I not noticed that powers of 3 could be helpful?!


FIGURE 7: What happens with powers of three?

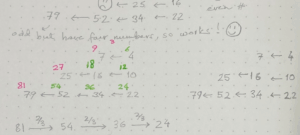
Looking more closely at the one successful sequence I had, and the unsuccessful ones(!), when working backwards, they all ended with a number that was 2 less than a power of three!!! Indeed, if I added in the ‘missing’ 2s, my sequences would start with a power of 3 and then go down to two-thirds at each stage.


FIGURE 8: Pattern spotting or noticing structure?

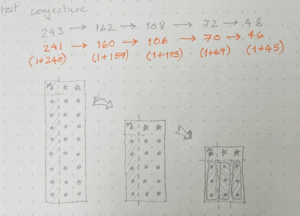
This structure, of powers of three, and that two-thirds would always then be an even number, aligned with the properties I had observed earlier (Figure 5). The offset of 2 wasn’t quite clear to me, though I knew some offset from 3k was needed to ensure the monkey’s share. This reminded me of the ‘Sharing 17 camels’ problem, and one idea could be to add two poison fruit to the pile of coconuts (which help with the division but remain unclaimed throughout). I had now (noticed) enough structure to use numerical, symbolic and even diagrammatic representations that would yield general solutions.


FIGURE 9: Testing numerical and diagrammatic conjectures

How can we be sure that these patterns will always work? I will leave that with you to explore!

As a final takeaway message, the ME322 materials say, “Choosing particular representations can help with noticing structure”. Something for me to bear in mind when trying to crack future puzzles!

Posted in Uncategorised | Leave a comment

Who needs Everyday Maths?

This gallery contains 5 photos.

This post is written by Gerry Golding, an OU staff tutor in Northern Ireland, who led the mathematics education team in creating a free  resource for improving adult numeracy and confidence with maths. Last month I wrote about our new, … Continue reading →

More Galleries | Leave a comment

Building confidence with Everyday Maths Northern Ireland (NI)

This post is written by Gerry Golding, an OU staff tutor in Northern Ireland, who led the mathematics education team in creating a free flexible resource for improving adult numeracy and confidence with maths.

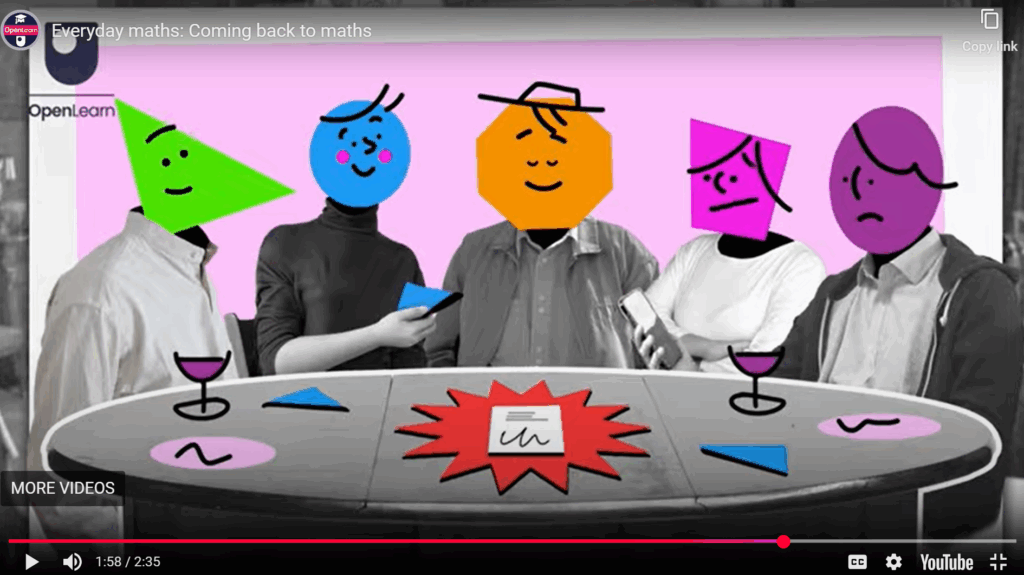
For many adults, young and old in NI, mathematics can be perceived as a barrier to career entry and/or progression. Everyday mathematics is often a hidden source of anxiety, left un-addressed for fear of ridicule. Even competent people avoid being put on spot when it comes to say splitting the bill after a dinner with friends in a restaurant.

Cartoon showing stylised people calculating a restaurant bill

Restaurant bill from the Coming Back to Maths video: who are you?

Working in a maths support centre at the University of Limerick before I moved to the OU, a common theme I experienced when talking to students about their first visit was the number of times they had gotten as far as the door, but couldn’t walk through it because of anxiety or some past unresolved issue with maths. For some, it took the support of a friend coming with them to walk them through the door of the centre.

The goal of the” Everyday Maths NI Multiply Project” is to be an enabler, to give people like this the confidence to walk through the “maths learning” door, to start, or restart, their maths journey and quietly build some resilience at their own pace.

Where did it start?

One of the flagship initiatives of the UK Shared Prosperity Fund (UKSPF) launched on the 13 April 2022 was the Multiply project. Funding was made available to support local authorities and devolved administrations in delivering tailored programmes to help adults improve their functional maths skills through free, flexible learning options such as personal tutoring, digital training, and community-based courses. Each region received a portion of the funding based on its UKSPF investment plan.

Two men in front of an Open University banner with courses displayed on laptops

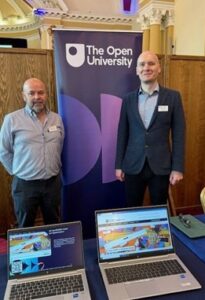
Gerry (left) launching Everyday Mathematics at Belfast City Hall

In Northern Ireland, the Multiply project aimed to improve adult numeracy skills by offering free courses tailored to fit around people’s lives and delivered through further education colleges, universities, local councils, and community organisations. Funded from 2024-5, the programme targeted over 3,000 adults across the region, addressing a significant skills gap as highlighted by the 2022 Employer Skills Survey, which found that a lack of basic numeracy contributed to a quarter of the skills-shortage vacancies in Northern Ireland.

Multiply in Northern Ireland included innovative pilots, such as numeracy training for non-native English speakers, with early results showing high success rates.  The OU in NI collaborated with our Mathematics Education group in the OU School of Mathematics & Statistics  to design a successful bid under the “Engaging Mature Learners – Making it Count” theme, creating materials that are available whenever they are wanted, for as long as they are needed.

The OU contribution

Updating existing content and education technology specialists, we created interactive “Everyday Maths Northern Ireland”  courses and learning materials on OpenLearn, the Open University’s free learning platform. The content in the two 48-hour badged courses maps the Essential Skills Numeracy curriculum in Northern Ireland. Each course is developed across four themes

  1. Working with Numbers
  2. Units of measure
  3. Shape and Space
  4. Handling data

    Course banner showing a woman smiling in front of mathematics words

    The home page of Everyday maths 1

The design is simple – Everyday Maths 1 is linked to Level 1 Essential Skills and Everyday maths 2 is linked to Level 2 Essential skills. And it is popular – Everyday Maths 1 has had 98,000 visits in the ten months since it started in October 2024.  We have tried to match our methods to follow how adults were taught mathematics in school and show how children are taught now.  This means parents can help their children with homework and feel confident that both methods work.

The courses are supported by additional learning materials.

We designed four bite-sized interactive everyday maths activities that teach a topic and check your understanding in less than 15 minutes.

  • Understanding Risk,
  • Statistics in the News
  • Ratios and proportions.
  • Keeping things in proportion – using our visual skills to navigate a data and image-rich world

For a taster, we drew on our mathematics education research and the experiences of OU students to create three short inspirational videos:

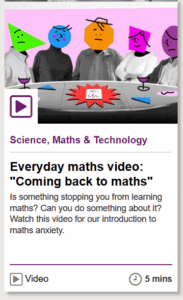
Mobile phone screen in the Open Learn format showing picture, title and links to an Everyday maths video.

How it looks on Open Learn

  • Coming back to Maths: recognising anxiety and building resilience
  • From zero to hero: it’s never too late, a student’s story

  • Doing Maths with AI apps: why learn maths when AI can do everything? The myth that maths is just about calculations.

In the next post we will tell you who we designed these materials for and what is happening next.


Posted in Uncategorised | Leave a comment

Engaged Research and Epistemic Justice in Mathematics and Statistics Research

What is engaged research?

Public engagement with Higher Education research (often shortened to HE-PE) is all about the different ways universities engage the wider public with their research and activities. The goal isn’t just to inform people, but to build positive, two-way relationships between universities and communities. According to the UK National Co-ordinating Centre for Public Engagement, it should involve genuine interaction and listening, with the aim of generating mutual benefit (NCCPE, 2020). Many UK academics feel a strong moral obligation to get involved in public engagement, and participation is often based on intrinsic rewards, such as wanting to share their research with broader audiences (Watermeyer, 2016), but academics also need to see how it benefits their own personal and professional development. Whilst most academic researchers agree that HE-PE should be based on a two-way relationship in practice it often follows a ‘deficit model’ approach, where academics decide what to share, when, and how, and the public is expected to just take it in (Grand et al., 2015).

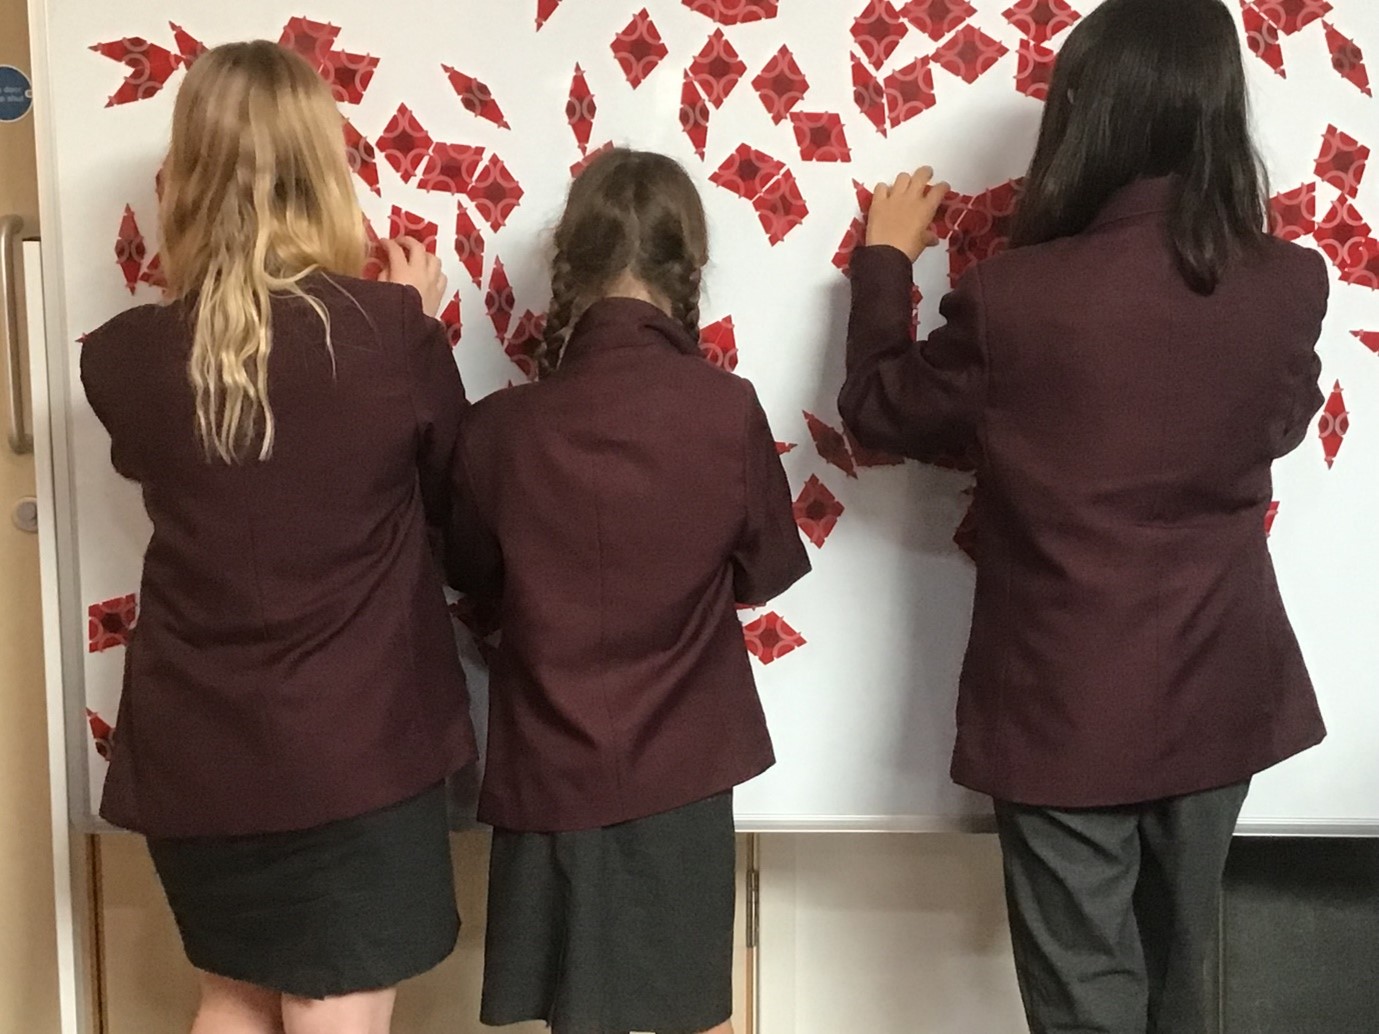
School students engaging with tiling puzzles at the Open University Aperiodic Tiling exhibition

Over the last decide, universities have been encouraged to rethink how they engage with the public, to not just present research to audiences, but to work with and include publics in the creative process (Grand et al., 2015). This is where engaged research comes in, a concept coined by Open University researchers (Holliman et al., 2015). Rather than one-off events or top-down communication, it’s a more intentional and collaborative approach. Instead of academics doing the research in isolation and then sharing it afterwards, engaged research brings in community members, stakeholders, or even school students as collaborators at different stages of the research, including sometimes at the very start of the research process (Holliman et al., 2015). It’s about breaking down the barrier between expert and audience and creating a more equal, inclusive way of doing and sharing research. Researchers and the public work together to ask questions, gather data, and make sense of the results. Everyone brings different experiences and knowledge to the table and different forms of knowledge, not just academic knowledge, are treated as valuable. Engaged research is built on relationships, trust, and shared learning.

The challenge is that it is not easy to achieve engaged research. According to Holliman et al. (2017), engaged research can take more time, more effort, and is often far more labour intensive than traditional academic research. It requires planning, communication, and can require a willingness to let go of control. Barriers such as research funding, short timeframes or university policies can make it difficult to plan for engaged research. For these reasons, some researchers still prefer to continue with more established models, because they feel simpler or more familiar. This means the most common kinds of HE-PE are still one-way, ‘top-down’, events including researcher led lectures, masterclasses, and demonstrations.

Why is it important to move beyond the deficit model of HE-PE?

Whether they are aware of it or not, academic researchers in mathematics and statistics hold power over the knowledge they create through their research. For example, they not only choose what to research (though this can be constrained by research funding) but they also make decisions about how to develop this research, whether to involve non-academic stakeholders in the planning process or data collection stages (Medvecky, 2018). They also choose how the research is shared within academic and non-academic communities, including which journals to publish with, which science fairs to present at, which schools or community groups (if any) to visit etc. This means that researchers have a responsibility to consider epistemic justice,  or fairness in knowing, that is, to consider how the knowledge they create is equitably distributed and beyond that, to make sure it is created fairly.

The concept of epistemic justice was developed by British philosopher Miranda Fricker (2017) to describe the ethics of knowledge production. It describes a fairness in the way knowledge is shared, created, and valued. In simple terms, it’s about making sure everyone has a fair chance to know things, and to be recognised as someone worth listening to.

Fricker (2017) describes two main types of epistemic injustice: Testimonial injustice and Hermeneutical injustice.

Testimonial injustice happens when someone’s knowledge or experience isn’t taken seriously because of who they are, or in contrast when someone’s knowledge is overly trusted because of who they are. For example, a professor in mathematics may be considered an expert over a hobbyist mathematician, even if the topic in questions is outside of the professor’s expertise and the hobbyist has a great deal of knowledge in this area. If the hobbyist’s opinion is dismissed because they are seen as a non-expert, that’s a form of testimonial injustice.

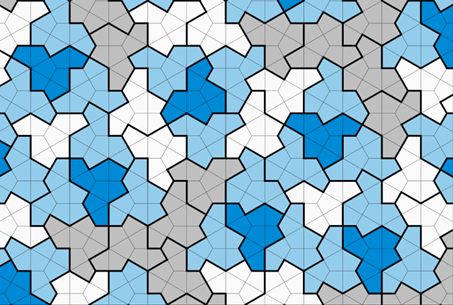
In 2022, a retired print technician and amateur mathematician, David Smith, showed the value of non-expert knowledge by making a significant discovery in the field of aperiodic geometry through creating an aperiodic monotile: a single aperiodic tile which could tile the plane. This discovery helped solve the previously unsolved Einstein problem.

Hat tiling created by David Smith

Hermeneutical injustice is when people don’t have the tools, language, or opportunity to fully understand or express their experiences. In a mathematics and statistics research context, this might mean not being supported to ask questions, challenge assumptions, or explore new ideas. For example, when a new mathematical discovery is made, if it is shared only in academic journals, using very technical language, public audiences may not have the tools to understand or question the discovery.

When universities rely on traditional models of public engagement, groups like school students, community members, or hobbyists can be unintentionally excluded from sharing their knowledge or from being able to learn, question and critique new knowledge. Not because they don’t have anything to offer, but because they aren’t always seen as serious contributors or given the opportunity to contribute. That’s not just a missed opportunity to learn from different groups of people and to expand knowledge production and exchange, it is also a form of epistemic injustice.

Holliman (2019) suggests that engaged research can help tackle issues of epistemic injustice by opening up space for more people to be seen, and to see themselves, as knowers. It values different ways of understanding the world, not just what’s published in academic journals. And that makes research fairer, more inclusive, and often more relevant to real-life challenges.

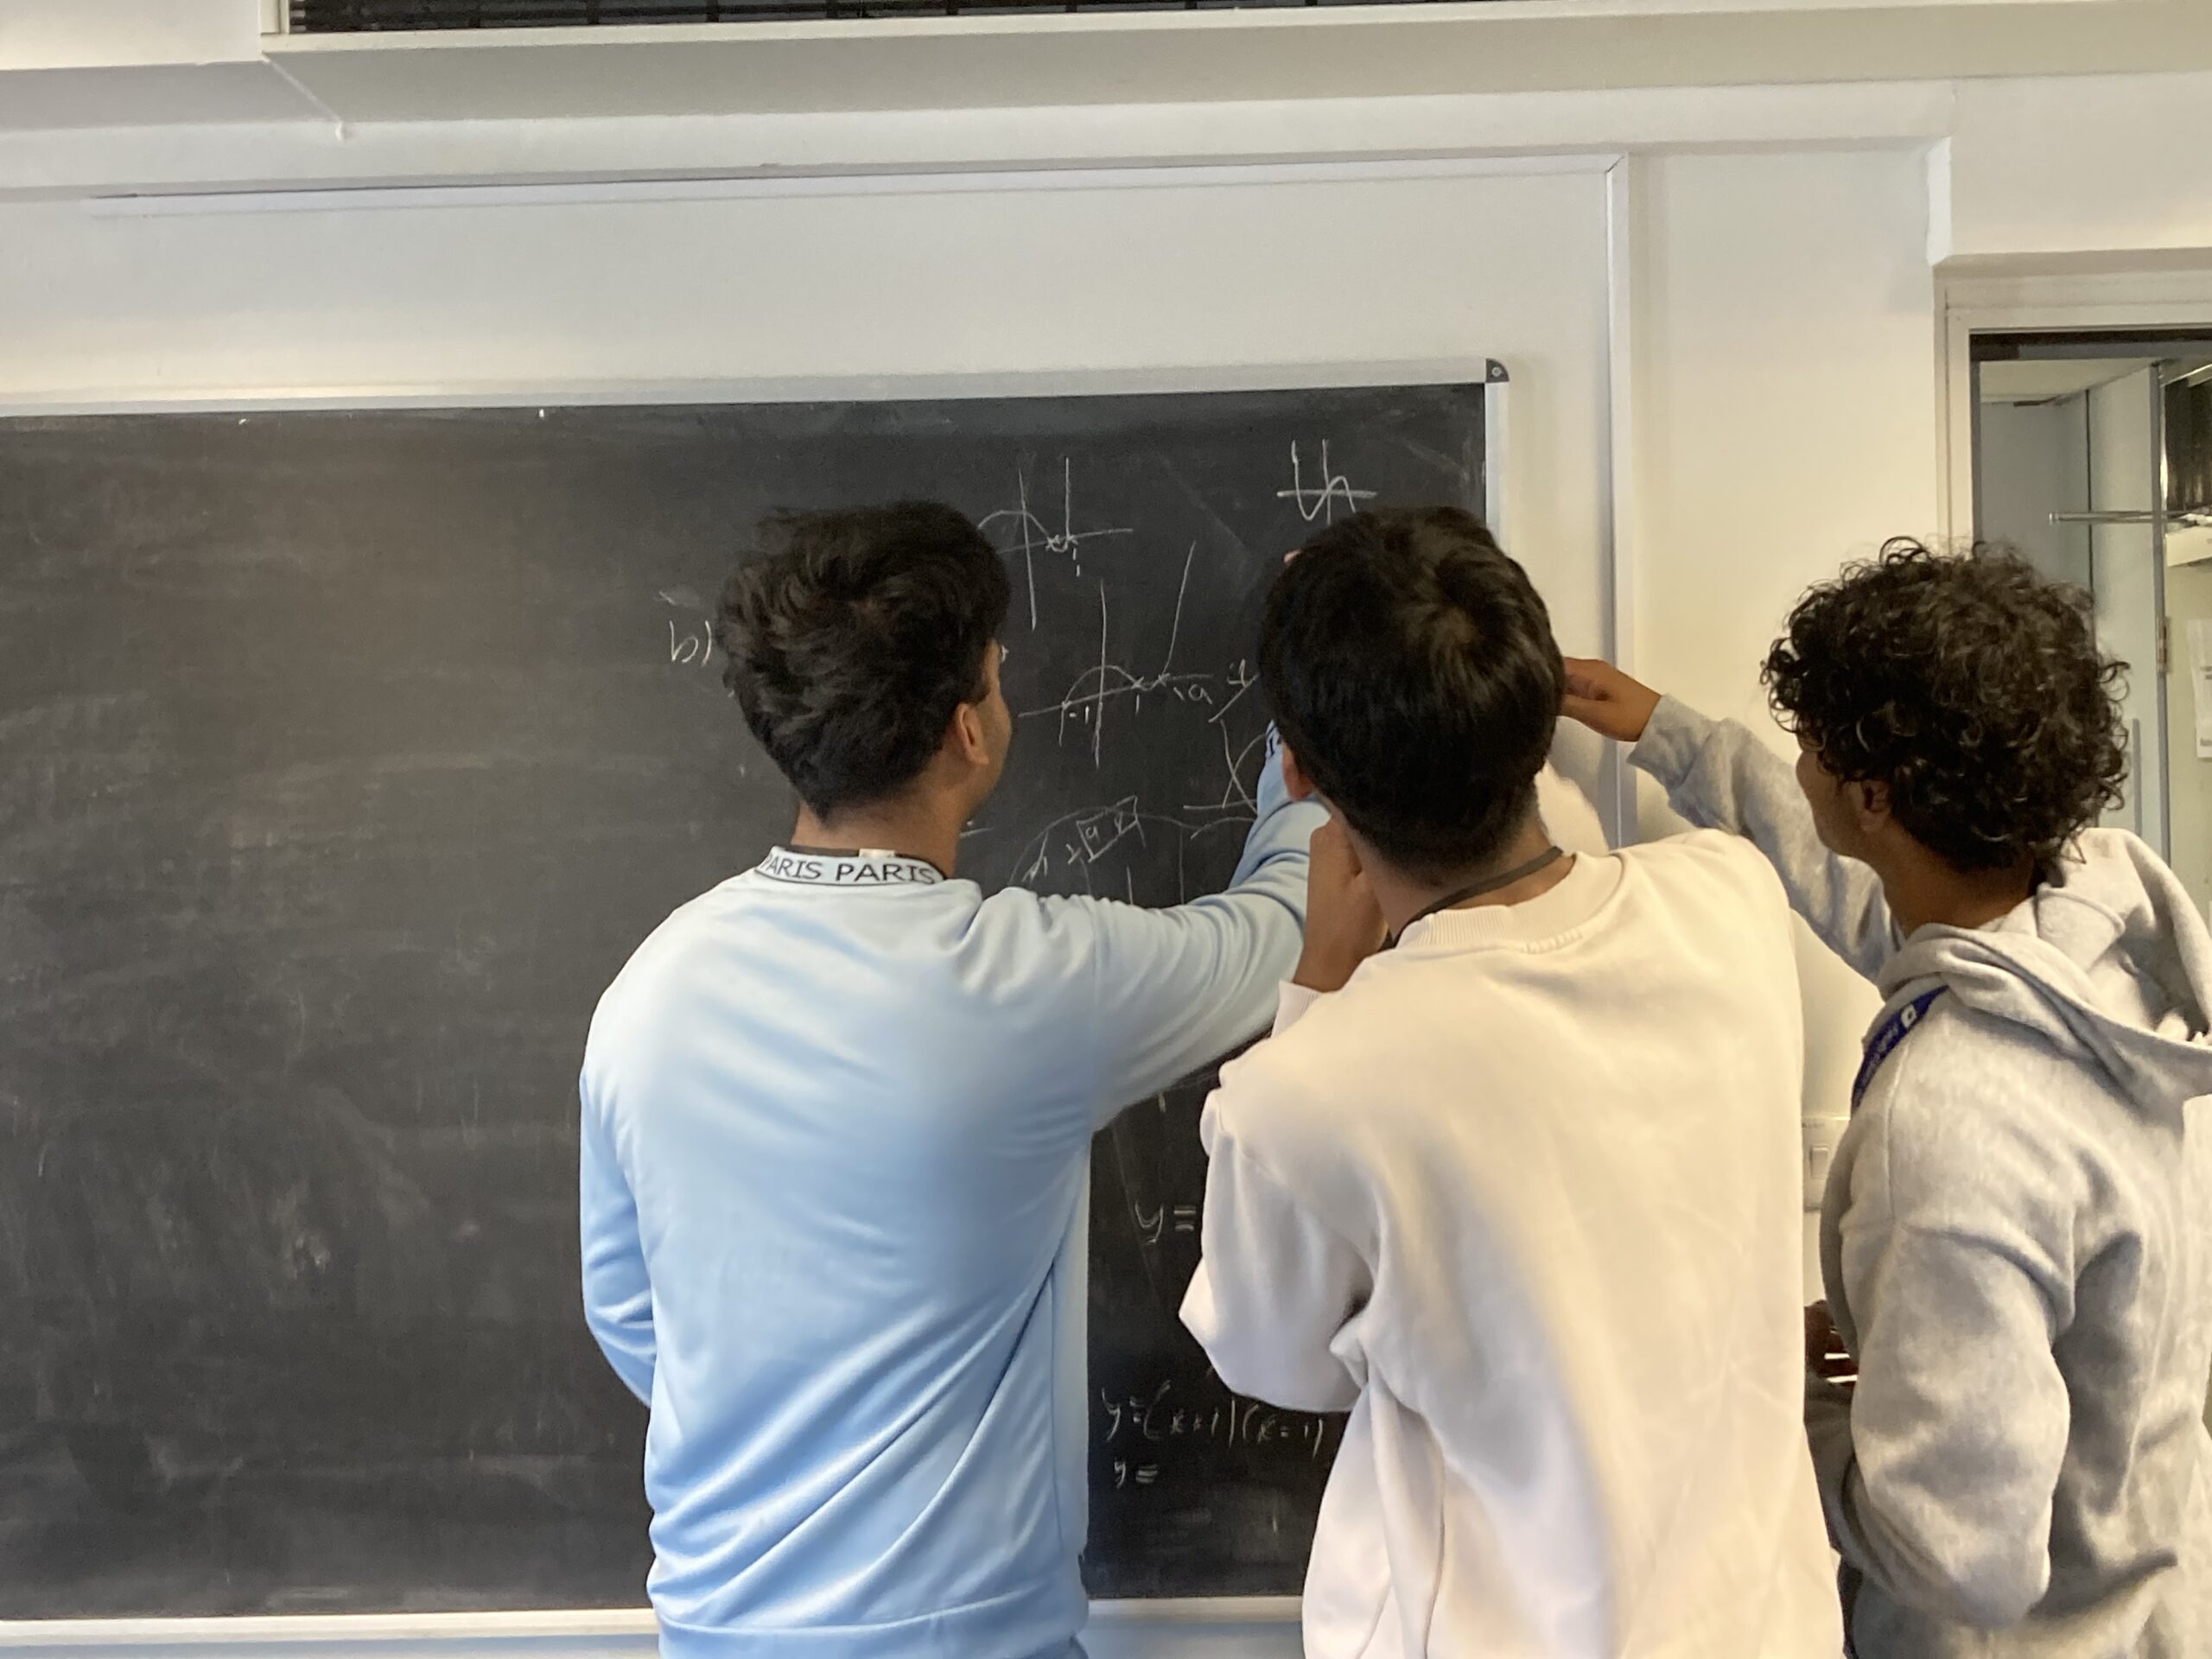
A-level students working on mathematical research at the Open University

Further reading

Rick Holliman, Professor of engaged research, gave his inaugural lecture entitled ‘Fairness in knowing’, about engaged research and epistemic justice. You can watch and read it here: Fairness in knowing’: How should we engage with the sciences? | The Open University

References

Fricker, M. (2017). Evolving concepts of epistemic injustice. In The Routledge handbook of epistemic injustice (pp. 53-60). Routledge.

Grand, A., Davies, G., Holliman, R. and Adams, A. (2015) ‘Mapping Public Engagement with Research in a UK University’, PLoS ONE, 10(4) pp. 1–19.

Holliman, R., Adams, A., Blackman, T., Collins, T., Davies, G., Dibb, S., Grand, A., Holti, R., McKerlie, F., Mahony, N., and Wissenburg, A. eds. (2015). An Open Research University. Milton Keynes: The Open University.

Holliman, R. (2019). Fairness in knowing: How should we engage with the sciences? The Open University, Milton Keynes. Online: http://oro.open.ac.uk/60416

Medvecky, F. (2018). Fairness in knowing: Science communication and epistemic justice. Science and engineering ethics, 24(5), 1393-1408.

National Co-ordinating Centre for Public Engagement (2020) What is Public Engagement? Available at: https://www.publicengagement.ac.uk/about-engagement/what-public-engagement.

Watermeyer, R. (2016) ‘Public Intellectuals Vs. New Public Management: The Defeat of Public Engagement in Higher Education’, Studies in Higher Education, 41(12), pp. 2271–2285. Doi: 10.1080/03075079.2015.1034261.


Posted in Uncategorised | Leave a comment

The benefits of studying mathematics in two languages (Cymraeg/Welsh and English)

This post is written, in both English and Welsh, by Dr Delyth Tomos, an OU Associate Lecturer who tutors on modules in mathematics and statistics, and engineering.

Delyth has recently co-led a project looking at Welsh-medium tuition in mathematics.  To learn more about the project, click here  

Ysgrifennwyd y neges hon, yn y Gymraeg ac yn Saesneg, gan Dr Delyth Tomos, Darlithydd Cyswllt gyda’r Brifysgol Agored, sy’n diwtor ar fodiwlau mewn mathemateg ac ystadegau, a pheirianneg.

Yn ddiweddar mae Delyth wedi cyd-arwain prosiect yn edrych ar addysgu mathemateg drwy gyfrwng y Gymraeg.  Er mwyn gweld mwy o wybodaeth am y prosiect, cliciwch yma.


As someone who has lived and worked in North Wales since birth, being exposed to two languages, Cymraeg/Welsh and English, is pretty much a way of life. Children are taught in both languages from an early age, and develop linguistic skills that allow them to participate fully in education, work, family and social activities in two languages, thus maximising the opportunities available to them.  Discussions in formal and informal settings are frequently conducted through both languages, switching from one to the other, and most of us do this with ease, hardly realising that what we are doing is much more complicated linguistically than we possibly realise.

Welsh landscape. Image credit David Kjaer / Nature Picture Library / Universal Images Group.

A bilingual education involves subjects being taught in both languages, and effective strategies have evolved over the decades, underpinned by a wealth of research in countries where living through the medium of more than one language is the norm (Spitzer, 2016 and Mukan et al, 2017). These strategies promote constructive learning where the use of two languages enhances a learner’s resilience and effectiveness within specific subjects as well as their language skills in general.

Learning mathematics through the medium of both Cymraeg and English encourages learners to acquire and develop flexible approaches to their studies. Understanding and learning how to solve mathematical problems requires a learner to develop a subject-specific vocabulary which needs to be incorporated within the learner’s wider language skills. In mathematics, a learner needs to be able to  describe  and interpret a problem, analyse and select relevant pieces of information from a given situation, organise the information, consider how this information may be used to address a particular problem, select and justify suitable mathematical methods, undertake various mathematical calculations and manipulations, and finally, to interpret their solutions or results in order to address the original problem.   It is clear that these strategies are complex, and it can also be seen that most of these skills are deeply embedded in language.

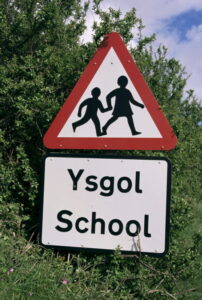
School sign in English and Welsh languages. Image credit David Hunter / Robert Harding World Imagery / Universal Images Group

When discussing mathematical concepts and terms in different languages, learners have opportunities to make connections with previous knowledge in both languages, and this, in turn helps them to construct their learning of mathematical ideas in both languages. Mathematical problems may be described and framed in a similar manner in two different languages, but the translation will not be exactly the same. Translation is not a matter of substituting one word from one language to an equal term in another language. Effective translation requires an equivalent adaptation of meaning in both languages in addition to syntactic flexibility and choosing suitable terms to delineate a problem in a manner that is accurate and helpful. Being creative and flexible as part of the translation process results in mathematical problems being conceptualized from two slightly different  directions, resulting in a deeper understanding of how to address problems.

Learning mathematics (and other subjects) through the medium of two languages thus provides learners with opportunities to fully engage in learning, in both their first and second language, and to engage with concepts from two slightly different directions. This in turn encourages them to become flexible, creative and resilient learners  and this naturally benefits mathematics learners.

Manteision astudio mathemateg mewn dwy iaith (Cymraeg a Saesneg)

Fel rhywun sydd wedi byw a gweithio yng Ngogledd Cymru ers ei geni, mae dod i gysylltiad â dwy iaith, Cymraeg a Saesneg, yn ffordd o fyw. Caiff plant eu haddysgu yn y ddwy iaith o oedran cynnar, a byddant un datblygu sgiliau ieithyddol sy’n caniatáu iddynt gymryd rhan lawn mewn addysg, gwaith, gweithgareddau teuluol a chymdeithasol mewn dwy iaith, gan wneud y mwyaf o’r cyfleoedd sydd ar gael iddynt.  Caiff trafodaethau mewn sefyllfaoedd ffurfiol ac anffurfiol eu cynnal yn aml drwy’r ddwy iaith, gan newid o’r naill i’r llall, ac mae’r rhan fwyaf ohonom yn gwneud hyn yn rhwydd, prin yn sylweddoli bod yr hyn yr ydym yn ei wneud yn llawer mwy cymhleth yn ieithyddol nag yr ydym o bosibl yn sylweddoli.

tirwedd Cymru. Credyd delwedd David Kjaer / Llyfrgell Lluniau Natur / Grŵp Delweddau Cyffredinol.

Mae addysg ddwyieithog yn golygu bod pynciau’n cael eu haddysgu yn y ddwy iaith, ac mae strategaethau effeithiol wedi datblygu dros y degawdau, wedi’u hategu gan gyfoeth o ymchwil mewn gwledydd lle mae byw trwy gyfrwng mwy nag un iaith yn norm. (Spitzer, 2016 A Mukan et al, 2017). Mae’r strategaethau hyn yn hybu dysgu adeiladol lle mae’r defnydd o ddwy iaith yn gwella gwydnwch ac effeithiolrwydd dysgwr o fewn pynciau penodol yn ogystal â’u sgiliau iaith.

Mae dysgu mathemateg trwy gyfrwng y Gymraeg a’r Saesneg yn annog dysgwyr i gaffael a datblygu ymagweddau hyblyg at eu hastudiaethau. Mae deall a dysgu sut i ddatrys problemau mathemategol angen i ddysgwr ddatblygu geirfa pwnc-benodol y mae angen ei hymgorffori o fewn sgiliau iaith ehangach y dysgwr. Mae angen i’r dysgwr allu disgrifio a dehongli problem, dadansoddi a dewis darnau perthnasol o wybodaeth o sefyllfa benodol, trefnu’r wybodaeth, ystyried sut y gellir defnyddio’r wybodaeth hon i fynd i’r afael â phroblem benodol, dewis a chyfiawnhau dulliau mathemategol addas, gwneud cyfrifiadau a thriniadau mathemategol amrywiol, ac yn olaf, dehongli eu hatebion neu ganlyniadau er mwyn mynd i’r afael â’r broblem wreiddiol.  Mae’n amlwg bod y strategaethau hyn yn gymhleth, a gellir gweld hefyd bod y rhan fwyaf o’r sgiliau hyn wedi’u gwreiddio’n ddwfn mewn iaith.

Arwyddion ysgol yn y Gymraeg a’r Saesneg. Credyd delwedd David Hunter / Robert Harding World Imagery / Grŵp Delweddau Cyffredinol.

Wrth drafod cysyniadau a thermau mathemategol mewn gwahanol ieithoedd, caiff dysgwyr gyfleoedd i wneud cysylltiadau â gwybodaeth flaenorol yn y ddwy iaith, ac mae hyn, yn ei dro, yn eu helpu i adeiladu eu dysgu o syniadau mathemategol yn y ddwy iaith. Gellir disgrifio problemau mathemategol a’u fframio mewn modd tebyg mewn dwy iaith wahanol, ond ni fydd y cyfieithiad yn union yr un fath. Nid yw cyfieithu yn fater o amnewid un gair o un iaith i derm cyfartal mewn iaith arall. Mae cyfieithu effeithiol yn gofyn am addasiad cyfatebol o ystyr yn y ddwy iaith yn ogystal â hyblygrwydd cystrawennol a dewis termau addas i amlinellu problem mewn modd sy’n gywir ac yn ddefnyddiol. Mae bod yn greadigol a hyblyg fel rhan o’r broses gyfieithu yn arwain at gysyniadoli problemau mathemategol o ddau gyfeiriad ychydig yn wahanol, gan arwain at ddealltwriaeth ddyfnach o sut i fynd i’r afael â phroblemau.

Mae dysgu mathemateg (a phynciau eraill) trwy gyfrwng dwy iaith felly yn rhoi cyfleoedd i ddysgwyr ymgysylltu’n llawn â dysgu, yn eu hiaith gyntaf a’u hail iaith, ac i ymgysylltu â chysyniadau o ddau gyfeiriad ychydig yn wahanol. Mae hyn yn ei dro yn eu hannog i ddod yn ddysgwyr hyblyg, creadigol a gwydn, ac mae manteision amlwg i hyn ar gyfer dysgwyr mathemateg.


References/Cyfeiriadau

Mukan, N.  et al (2017). The Development of Bilingual Education in Canada. Advanced Education, Issue 4(8) pp. 35 – 40.

Mukan, N. et al (2017). Datblygiad Addysg Ddwyieithog yng Nghanada. Addysg Uwch, Rhifyn 4(8) tt. 35 – 40.

Spitzer, M (2016). Bilingual Benefits in Education and Health. Trends in Neuroscience and Education, Volume 5, Issue 2, pp 67-76.

Spitzer, M (2016). Buddion Dwyieithog mewn Addysg ac Iechyd. Tueddiadau mewn Niwrowyddoniaeth ac Addysg, Cyfrol 5, Rhifyn 2, tt 67-76.


Posted in Uncategorised | 1 Comment

Making Graphs accessible: prize-winning student work with a visually-impaired learner.

This post is written by Ben Leslie, winner of the Stanley Collings prize in 2024.

The Stanley Collings prize is awarded annually by the School of Mathematics and Statistics. The prize is awarded to the student who best combines innovation in devising materials suitable for learners and insightful analysis of their learning. The post is a rewritten version of his final assignment in Learning and Doing Algebra (ME322).

Congratulations Ben!

While studying the module Learning and Doing Algebra, I worked with an adult learner, who I call Ina, and who is completely blind.  Mathematics is generally taught as a visual subject so my objective was to make the tasks accessible but also to introduce concepts such as graphical illustrations that are common in the workplace.  I chose the following task from the module to introduce graphs and explain how to use them.

Task 11 What’s the story?

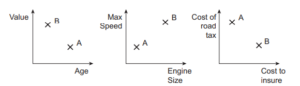
The following graphs provide information on two cars (car A and car B):
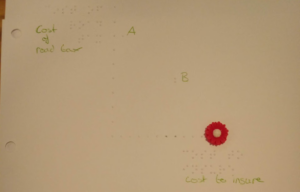
This figure shows three graphs which display information about cars A and B using two crosses on a set of axes. The labels of the axes change each time, and none of the axes have numbers.The first graph has a horizontal axis labelled Age and a vertical axis labelled Value. There is a cross marked B towards the top left corner. There is a cross marked A towards the bottom right corner. The second graph has a horizontal axis labelled Engine Size and a vertical axis labelled Max Speed. There is a cross marked A towards the bottom left corner of the graph and a cross marked B towards the top right corner. The third graph has a horizontal axis labelled Cost to insure and a vertical axis labelled Cost of road tax. There is a cross marked A towards the top left corner and a cross marked B towards the bottom right corner.

Comparing cars A and B

(a) Are the following statements true or false?
(i) car A is more expensive than car B.
(ii) car B is faster than car A.
(iii) car A costs less to insure than car B.
(iv) the older car costs more in road tax.
(v) the faster car costs more to insure.
(b) Write a short description for car A and car B.
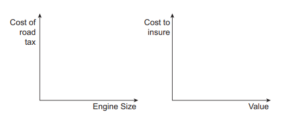
(c) Use these axes to mark crosses to represent car A and car B.
This figure has two empty pairs of axes, similar to those in the figure above.The first has the horizontal axis labelled Engine Size and the vertical axis labelled Cost of road tax. The second has the horizontal axis labelled Value and the vertical axis labelled Cost to insure.

Axes for comparing cars A and B

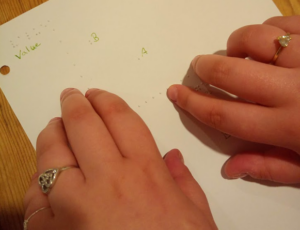
I printed Braille graphs and selected dots or distinctly shaped beads to represent the cars. I wanted Ina to develop the algebraic reasoning to understand how the distance from the origin on each axis represented the value of the axis title.

I printed a line of Braille dots for each axis and read aloud each task instruction and question. I mentioned that she need not give exact values, only its relation to the other car, for example, ‘Car A is older than B.’ She used this language when reasoning her responses to the statements. For statement (a)(i), she answered ‘False, car B is more expensive because it is younger.’ I re-phrased the question to, ‘Ignoring age, which car is more expensive?’ (I will elaborate why later, but I wanted her to practise using the y-axis.)  She finished the remaining statements without much difficulty and gave good descriptions of the cars that I recorded.
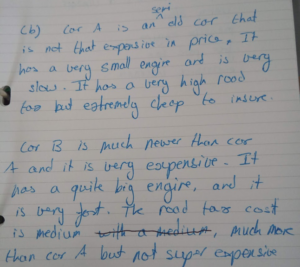
Handwritten answers as follows, with some text struck through: Car A is a semi old car but is not that expensive in price. It has a very small engine and is very slow. It has a very high road tax but extremely cheap to insure. Car B is much newer than car A and it is very expensive. It has a quite big engine, and it is very fast. The road tax cost is medium with a medium, much more than car A but not super expensive.

Ina’s answers

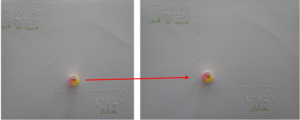
In part (c) Ina’s difficulty using the y-axis resurfaced when she tried to represent both variables on the x-axis. For example, she correctly placed car A on the x-axis for value before moving it along the same axis to identify the cost of insurance.

The figure shows two copies of the same Braille graph with a sweet placed differently on each graph. The horizontal axis is labelled Value and the vertical axis is labelled Cost to insure. In the first graph, the sweet is placed just above the horizontal axis, about 5 dots along. In the second, it is placed at the same height but only 1 dot along the horizontal axis.

Using the horizontal axis for both variables

With a simple prompt she recognised and corrected it.

The last part of the question was to imagine a third car, C, describe it and add Car C to all the graphs. Ina described car C using extreme terms: “super- valuable, super old – its a vintage; very slow, massive engine, free road tax, expensive insurance”.

This shows a Braille graph. The horizontal axis is labelled Cost to insure, the vertical axis is labelled Cost of road tax and cars A and B are marked, all in Braille and handwriting. A sweet is placed with its centre on the horixontal axis about 12 dots along.

I influenced her choice to give car C free road tax. It would be eligible for free road tax as it was vintage, but also, it would give her a zero value to work with which I wanted to see her represent in the graph, especially because road tax was the y-axis which she found difficult. She managed this successfully.

When analysing my learner’s work, I identified three module ideas which are related to her key moments and decisions. They are relations, covariation and Invariance and change (all Open University, 2023).

Relations

I described letting my learner know that she did not have to assign values to each variable. Although there was nothing wrong with doing this, I felt it was important for her to be able to compare the cars without necessarily doing arithmetic. Inequalities can be used in algebraic expressions and being more confident with using the terminology ‘greater than’ and ‘less than’ will enable her to progress future mathematical study.  This was also an important skill to have for the true or false statements, which were expressed as inequalities.

Covariation

When my learner said car B was more expensive because it was younger.’ I re-phrased the question to, ‘Ignoring age, which car is more expensive?’ Although an onlooker may have recognised that she had given the correct answer and possibly even jumped ahead to identifying covariance, I wanted to double check that she had used the y-axis and was not just making the general assumption that new cars are more expensive than used cars. I was glad I checked, as it turned out that she had not used the y-axis. This also revealed that she had more difficulty reading the y-axis than the x-axis which is something we then worked on throughout the task.  After ensuring she was reading the graphs correctly, I revisited her first answer and explored covariance. I congratulated her for pointing out there is often a relationship between the age and value of items and explained that covariance does not imply causation. I encouraged her then, throughout the rest of the tasks, to identify if the covariations between different aspects of the cars make sense, for example, if the engine is larger,  would the max speed be expected to change? It was interesting to watch which covariances she carried through in car C. For example, she continued with age and speed varying together, but age and value varying separately as she accounted for it being vintage.

Invariance and Change

This task was set out well and allowed for my learner to not only explore different covariations, but also to change which relationships are explored. In part (c) two empty graphs were given. The change here was that the cost to insure, which was on the x-axis in the previous graph, became the y-axis in the new graph. Additionally, the value of the cars, which was previously a y-axis became an x-axis. This helped my learner ground her understanding of the y-axis as she converted the approximate distance of y-variable from the origin, into an x-variable and vice versa with the cost to insure variable.

Reflection

When choosing and preparing the tasks throughout this module, I had focused on improving my abilities to make them accessible and meaningful to my blind learner. On reflection, my preparations have improved dramatically from her first tasks, where I used random objects at hand as representations of numbers or symbols, to now where in this example I have carefully thought out how to write the task in an accessible format with clear meaning. This allowed me to follow Bruner’s modes of representation (Open University, 2023) to help use tangibility to lay the foundation for concepts which can later be simplified into Braille symbols or even calculated mentally.

I often had to apply the module concept of using variation in teaching to ensure that my learner grasped the concepts intended in the session (Open University, 2023). This would range from me needed to rephrase questions, like I did in this task, or writing new problems that would stretch my learner’s thinking. This is related to the module idea of freedom and constraint (Open University, 2023), and I would often try to introduce or remove a constraint in her tasks to  enhance the learning experience, in this task I did that more subtly by encouraging her to use free road tax for car C.

Another module concept that I focused on was conjecturing and convincing (Open University, 2023). I liked the idea of allowing my learner to create her own conjectures based on the evidence in front of her, and then by testing that, was able to convince herself she was right. I really felt this was something important I wanted my learner to experience as I didn’t want her to have my educational experience – knowing what the right answer was, without knowing  it was the right answer or  it came from.

Overall, I have been struck by how the module ideas, when combined, demonstrate a very explorative and exciting way to teach and learn algebra. Before starting the module, I was anticipating there would be one or two clear-cut, tried and tested methods of drilling algebraic concepts into student’s heads. But I have enjoyed how the learning experience has been more focused on enabling the learner to learn and discover for themselves and share that excitement with their teacher, who can also learn or observe something new in every lesson.

References

The Open University (2023) ME322: Learning and doing algebra.

Posted in Uncategorised | Leave a comment

Mathematics at different speeds

Written by Lecturer in Mathematics Education, Vinay Kathotia

Here’s a mathematics puzzle: Suppose you walked up a hill at a constant speed of 3 kilometres per hour and you immediately walked down the hill taking the same route but at a constant speed of 5 kilometres per hour, then what is your average speed for the full round trip?

You can work on this using your preferred approaches, but if one asked you for your quick or intuitive answer what would it be? And how confident are you about it?

Spoiler alert! We share solutions to this puzzle below, so if you would like to work on it for yourself first, please do that before returning here.

Image of person walking downhill.

Walking downhill. Image thanks to KimJaesub (Pixabay)

Many people when posed this puzzle propose the answer 4 kilometres per hour (kmph), though simultaneously, they are not quite sure about this answer, say compared to their answer for 3 + 5 = ? There are good reasons for their answer, and for their scepticism, and we will explore that here.

Nobel laureate Daniel Kahneman and his colleague Amos Tversky have done substantial research on human judgment and decision making. In his book, Thinking Fast and Slow, Kahneman shares some of their research and approaches. They hypothesise that our minds have two ‘systems’, System 1 produces fast, automatic/instinctive responses with seemingly little effort, whereas System 2 is slower, effortful, allocates attention and can regulate our (default) use of System 1. Moreover, System 1 exhibits ‘no sense of voluntary control’, while System 2 operations relate  to ‘agency, choice, and concentration’ (Kahneman, 2011, p.4).

We need to bear in mind that these ‘systems’ are models or metaphors, we don’t fully understand the workings of the mind, but there is substantial evidence for the patterns of thought and judgment that Kahneman outlines. What does this have to do with our puzzle? Our hypothesis is that reaching out for 4 kmph as the average of 3 kmph and 5 kmph is an instance of doing mathematics fast (System 1 thinking), whereas any unease you may have and the desire to work it out at your pace could be an expression of System 2 thinking. So how would you or did you go about solving this puzzle. Below we share two approaches, both of which align with what we would call Slow Mathematics – our preferred approach!

Make it real or realisable
Speed, the measure underlying this puzzle is a compound measure (it sets up a relationship between two more basic measures, distance and time). Research tells us that learners can find reasoning with compound measures difficult but, as mathematics is often about studying relationships between variables, working with compound measures can be critical for developing mathematical reasoning. One approach is to use numbers and units that you are comfortable using, that are realisable for you and/or make sense to you.  Notice the problem does not tell us how long (in kms say)  the trek uphill is. So could we choose a distance  that is easy to work with. It need not be realistic but something that makes the mathematics more accessible and realisable. I would suggest a 15 km trek. Why? Setting that question aside for a moment, verify that our trip uphill would take 5 hours and the faster downhill leg would take 3 hours. Notice this approach somehow does away with the ‘compoundness’, having us work with simpler numbers and units one at a time. So our total trip of 15 + 15 = 30 kms has taken 3 + 5 = 8 hours. We can now work out that the average speed is 30/8 kmph or 3.75 kmph. So not far from 4 kmph but lower than that. Is there some way we could have assessed or estimated that earlier?

Going to extremes
One approach when grappling with mathematical problems is to vary the problem, seemingly making it even more difficult, but the variation can help clarify underlying relationships. So suppose you went uphill at 3 kmph but came down at an excruciatingly slow pace (almost 0 kmph), then what would your average speed for the round trip be? Would it be close to the average of 0 and 3, say 1.5 kmph, or closer to 0 kmph, or closer to 3 kmph? Similarly, if you were to whizz down at close to the speed of light, what would your average speed be? Do explore these thought experiments and it may help you see that average speed over two equal-distance legs need not be the mean of the speeds over each leg. Which leg will you be spending more time on, which will therefore be your dominant experience – the fast or the slow one? And how will that impact the average?

Fast or slow mathematics
Traditionally, mathematics seems to reward quick answers. We assess students on timed exams, we search for and value quick algorithms. On the other hand, mathematics with understanding requires noticing what we do, using one approach and then another (… and another), using different representations and making connections. These may slow things down but may also provide a longer and more fruitful journey.

How do you think of fast or slow mathematics, or doing mathematics at all in the emerging era of generative AI? Do leave your thoughts below, and we will pick that up in a future blog. Meanwhile, take it slow!

References
Kahneman, D. (2011). Thinking, fast and slow. Farrar, Straus and Giroux.

Posted in Uncategorised | Leave a comment

Diffusion of the Dead: The Mathematics of a Zombie Invasion!

Have you ever wondered just how long it is before a zombie shuffles into view? It might sound like something direct from a horror film, but knowing how soon you’ll need to dodge or outrun the undead could mean the difference between life, death, and – even worse – zombification!

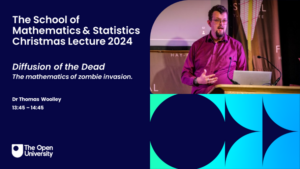
Each year, on the first Tuesday in December, we hold our Christmas lecture for schools. This is an online event in which we invite a mathematician to talk about a current area of interest in mathematics in a fun and engaging manner to an audience of school students aged 16-18 from across the UK who are studying mathematics.

This year, we were thrilled to welcome Dr Thomas Woolley from Cardiff University, whose work in mathematical biology explores topics such as pattern formation and diffusion. In his spirited presentation on the mathematics of surviving a zombie apocalypse, Thomas expertly balances storytelling with serious mathematics, using secondary school calculus and horror-movie references to reveal what happens in the event of a zombie apocalypse.

If you’re eager to dissect the gruesome details – and pick up a few tricks for outsmarting zombies – be sure to check out the mathematics of surviving zombies with Thomas here where he explains things far better than I can!

Mathematics Enrichment

The OU Christmas lecture is an example of a mathematics enrichment event, in which our aim is to motivate students to study mathematics at university. By introducing new and exciting aspects of the subject not included in the school syllabus, we help students discover that mathematics is a dynamic and creative subject, replete with novel ideas and practical applications.

Creating an Enriching Event

One approach to planning and evaluating mathematics enrichment is to consider such events as opportunities outside the classroom to bring about “engagement” with mathematics (Santos & Barmby, 2010). In education it is common to think about “engagement” as having three aspects:

1. Behavioural Engagement

  • Are learners paying attention?
  • Are they actively participating?

2. Emotional Engagement

  • How are learners feeling about the activity?
  • Is it creating positive reactions and curiosity?

3. Cognitive Engagement

  • Are learners exerting effort towards understanding the content?
  • Are they understanding the advanced concepts?

Ideally, any enrichment event satisfies all three aspects.

Choosing the Right Topic

Selecting a topic that’s new and intriguing but still within reach of school-level mathematics is crucial. Too advanced or abstract, and students may feel overwhelmed or lose interest. Too simplistic, they might become bored. The ideal event blends familiar ideas (like basic calculus) with novel or popular contexts (like zombies), making it both accessible and relevant.

That’s exactly what Dr Thomas Woolley achieved:

  • Thomas introduced real-world applications of mathematics to biology, such as animal patterns and swarming animals
  • Thomas incorporated pop-culture references (zombies, horror-movie monsters)
  • Thomas kept it interactive and playful, allowing students to contribute their own ideas about the philosophy of gothic horror

Modelling a Zombie Apocalypse

In his talk, Thomas initially took us on a quick tour of some applications of mathematics to biology, and biology to mathematics. He discussed how mathematics can be used to model swarming animals, and how it can be used to explain how stripes or spots form on some animals, showing everyone new and intriguing applications of mathematical ideas.

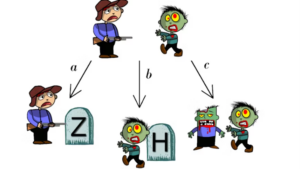
The inclusion of zombies wasn’t just an entertaining gimmick – there was serious maths involved. Using school-level calculus, Thomas explored diffusion processes, illustrated by simulations and videos of real experiments. The lecture provided a compelling example of how mathematical models can predict the movement of large groups, whether they’re flocks of animals or lumbering hordes of the undead.

Regarding survival tactics, Thomas demonstrated how a few strategic choices—like placing obstacles or, even better, simply running—could mean the difference between escape and joining the ranks of the zombies. Who knew calculus could save your brains?

Zombies might be fictional, but the underlying mathematics is very real—so keep your wits (and your brain) about you, and who knows what you’ll discover about the living world and beyond!

We hope this lecture inspired you to explore the applications of maths to real and fictitious scenarios. Have questions, comments or ideas? Share them below or connect with us on X and BlueSky @OUMathsStats.

Eager to get your school involved? Don’t hesitate to reach out to us at [email protected]. We’d love to hear from you!

Dr Andrew Neate, External Engagement Co-Lead, School of Mathematics and Statistics

Key Takeaways

  • The OU Christmas Lecture 2024 featured Dr Thomas Woolley, who explored the mathematics of a zombie apocalypse using calculus and mathematical modelling.
  • This event exemplified a successful mathematics enrichment activity, achieving behavioural, emotional, and cognitive engagement among students.
  • Through the creative use of a pop-culture topic (zombies), familiar mathematical concepts (calculus) and engaging storytelling, Thomas delivered an inspiring and effective learning experience.

Santos, S. & Barmby, P., 2010, Enrichment and engagement in mathematics. In Proceedings of the British Congress for Mathematics Education April 2010. (https://bsrlm.org.uk/wp-content/uploads/2016/02/BSRLM-IP-30-1-26.pdf )


Posted in Uncategorised | Leave a comment

It’s not about the answer

Everyone loves a puzzle, don’t they?!

One of the pulls that drew me to maths is the satisfaction that comes from solving problems, that, and the fact it is fun!

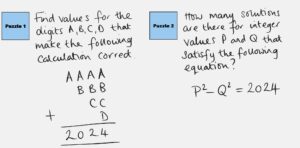
In the May 2024 edition of the maths and stats (M&S) student newsletter, OpenInterval, there were two puzzles posed, sent in by one of our M&S associate lecturers, Bob Vertes:

Two handwritten maths puzzles

Here’s my approach to Puzzle 1.

The use of different letters for the digits means 4 different digits, moreover single digits. This narrowed down my possibilities to the ten digits, 0 to 9.  Reflecting now, there are still a large number of options – over 5000 ways (permutations) of selecting 4 different digits from 10:

10x9x8x7=5040

More information definitely required to reduce the possibilities!

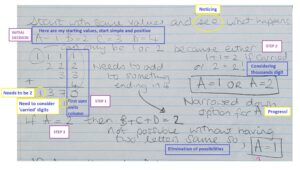
I figured I would just start simple and try some values to see what happened.

Notice my use of the word ‘figured’. Figuring in this sense means to think or consider but can also mean to calculate; perhaps my choice of language is influenced by the fact I am solving a maths problem.  I also use the word ‘see’ – I am looking at the problem and noticing what happens when I try something; it is important to pay attention to what is happening to make some sort of structured progress, rather than just haphazardly working through a myriad combination of digits. This can be seen as an example of “Noticing Structure”, a module idea developed in our ‘Learning and Doing Algebra’ (ME322) module.

I began by summing the units column, just as taught when learning column addition.  This led me to think about extra digits to consider, those that get ‘carried over’. For the thousands digit in the answer to be a 2, I would need a 1 carried over to combine with my existing 1.  Alternatively, ‘A’ would need to be 2 and nothing carried over from the hundreds.  ‘A’ could not be larger than 2, possibilities reduced by 80% in one move!

Note: automatic assumption I seem to have made without realising, ‘A’ cannot be 0.

I moved my attention to the units column; what would happen if ‘A’ was 2?

Look at the hundreds column. If ‘A’ is 2 then A + B + ‘anything carried’ would need to end in a zero but this would force a carry over into the thousands which is not wanted.

‘A’ cannot be 2.

Confirmation, ‘A’ should be 1.

Possibilities halved.

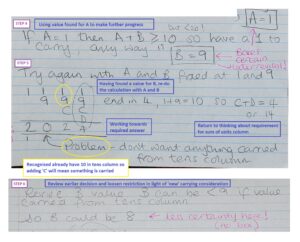
For the thousands digit in the answer to be 2, another 1 carried from the hundreds column is therefore needed. At this point I merrily proceeded to find that ‘B’ is 9, only for my confidence to be shaken at a later stage.

With my certainty shaken, I continue carefully.

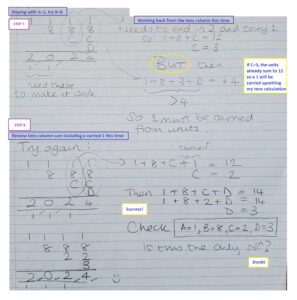
If I can fix ‘B’, my remaining possibilities will be reduced significantly.

A final box confirms I am certain with my solution but spot the little doubt that has crept in with my question.

Mathematics is about confidence, but it is also about questioning and analysing and unpicking; all mathematical thinking.

As a maths teacher for many years, I am only too aware of and, always intrigued with, the many different methods pupils use to approach and solve problems.  Whilst we can demonstrate particular ways to solve a problem, there is usually no single correct way.  By looking at the approaches of others, we develop our own understanding of maths and its interconnectedness making links between our existing knowledge and knowledge, methods and ideas that may be new to us.

The next time you see a puzzle that needs solving, rather than rushing to get to the answer, take time to notice the steps you take along the way.

Now for Puzzle 2…

Posted in Uncategorised | Leave a comment