
Concha and I attended this online seminar on the 23.09.12, on behalf of eFeP. We updated the programme colleagues on the progress of this project, focusing more specifically on the FACT method for evaluating tutor feedback.
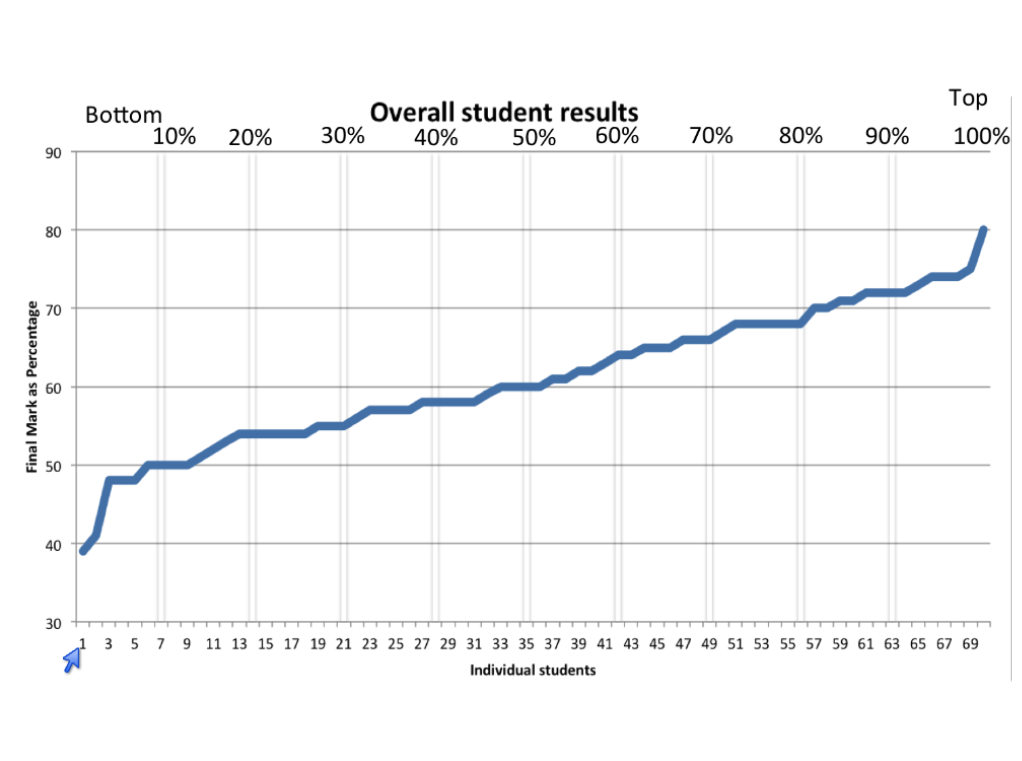
A number of other projects from Strand B were presented, amongst which was the EBEAM project, presented by Cath Ellis from the University of Huddersfield. One feature of particular interest to us within the EBEAM project was that students are given acces to statistical information about the overall performance of their cohort. For example, an individual student can see a graph showing the distribution of marks overall (first for the entire assignment, and then for each marking criterion), as well as a series of bar charts indicating the ranking of students in relation to individual features of their work, such as a ‘good introduction’. Of course the information is anonymous, but individual students know where to place themselves and can take stock from the feedback. Norm-referenced feedback such as this has potential drawbacks and ethical implications, which were also discussed, but the evaluation from the EBEAM team was positive.
These are a few examples of the kinds of statistical data that students can see (click on each thumbnail to see a larger image):

