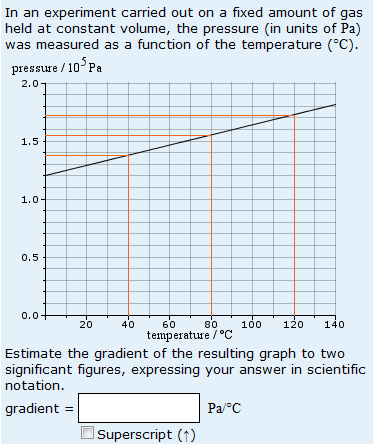
Consider the simple question shown below:
This question is generally well answered, but when students make a mistake, what do they do wrong?
The most common mistake (5.7% of non-blank responses) is to calculate the gradient as if the line went through the origin. After that, the problem is units again – 5.3% of responses contain incorrect units whilst 2.5% contain no units at all. And 4.0% of non-blank responses are incorrect because they are not given to two significant figures.
Now consider a question (below) that is more difficult in one regard only. Suddenly we have 16.4% of responses that have failed to take the ‘/105 Pa’ into account.
And finally, in the question shown below, things really get interesting. The graph is plotted for negative values of temperature, but the gradient is positive – you can see this by looking at it. However, 16.8% of responses give the negative of the correct answer. And for some reason students start getting the answer upside down too – 2.7% are the reciprocal of the correct answer and 2.0% are the negative reciprocal of the correct answer.


