These days following a progressive move of Higher Education Institutions towards blended and online environments, accelerated by COVID-19, many universities have access to a greater variety of student data than before. Learning Analytics (LA) provides means for collecting and analysing such evidence. In order to make this analysis useful to the end user, LA data are aggregated in the form of a Learning Analytics Dashboard (LAD). LADs visualise and predict students’ learning progress based on demographics, performance, and digital learning footprints data and have a strong potential to provide useful insights into how teaching and learning may be improved.
The Open University Analyse (OUAnalyse) is one such LAD, developed by an interdisciplinary team from Knowledge Media Institute and Institute of Educational Technology at the OU. The team’s work has received international recognition – OUAnalyse was selected as a finalist of the 2020 UNESCO Prize for the Use of ICT in Education. OUAnalyse is currently available to all OU teachers. In the dashboard, student predictions are updated every week, and various graphs provide a user-friendly visualisation of student data (see Fig 1 below for an example of such visualisations). Teachers use the dashboard and then proactively engage with their students to provide them with timely support that can help ‘save’ them before they fail.
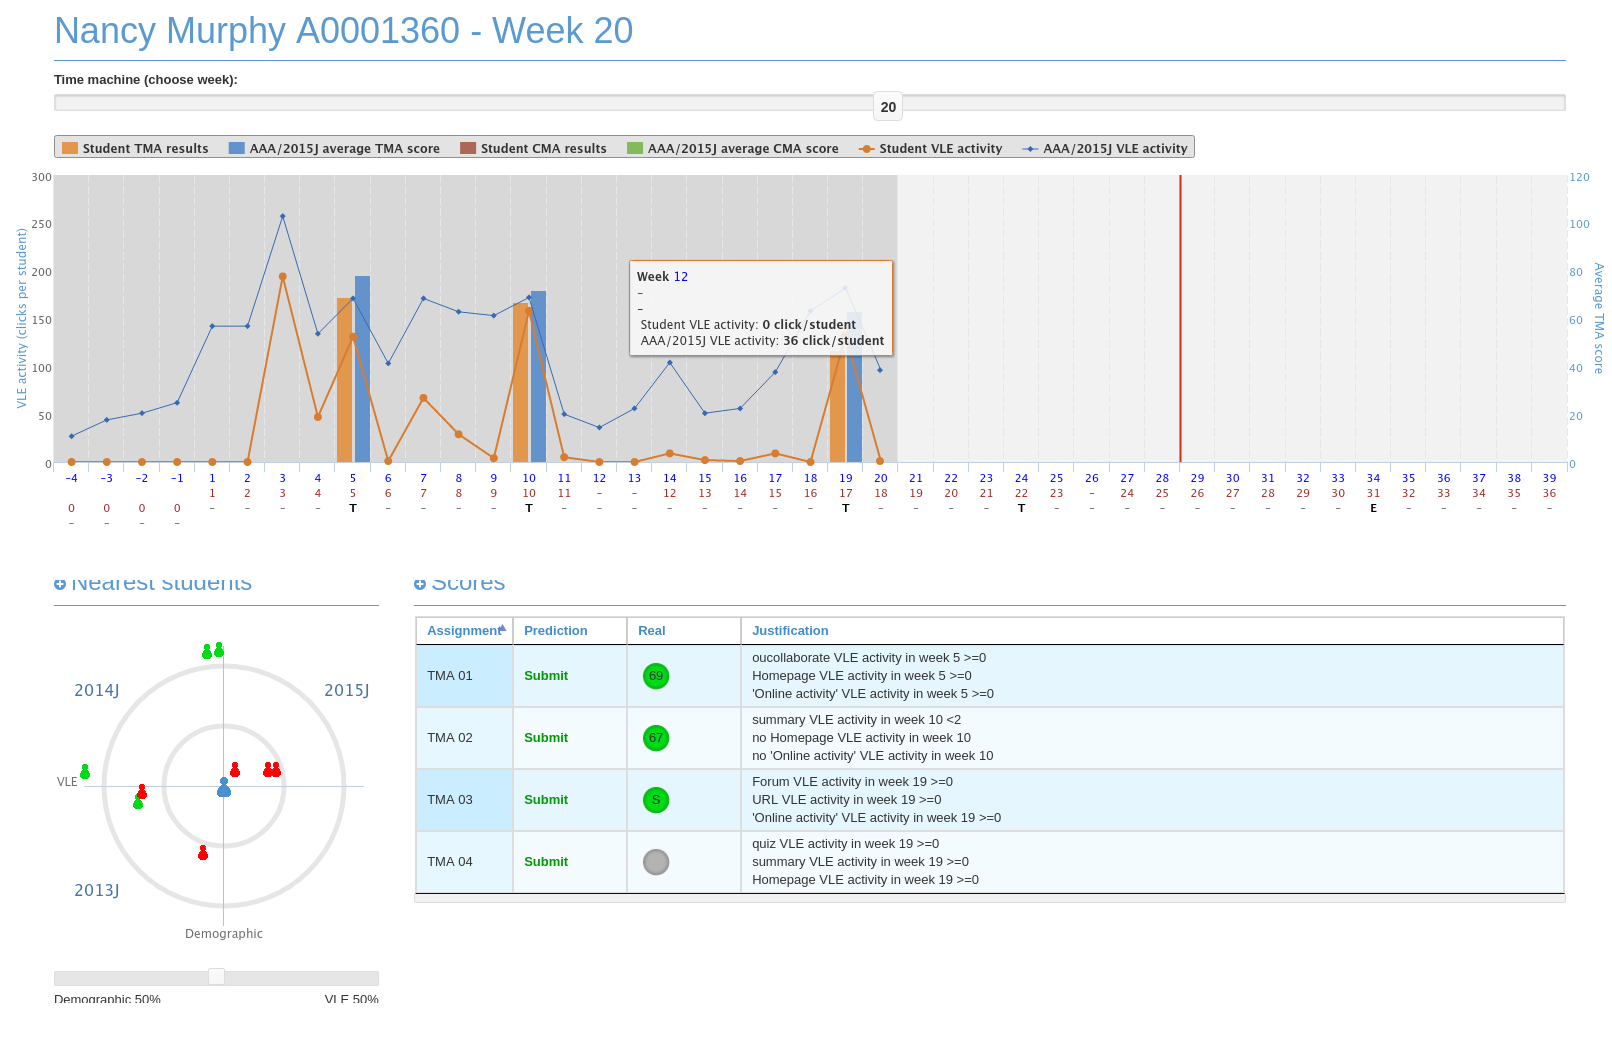
Figure 1. Examples of student data visualisations in OUAnalyse
LADs are a promising tool, and previous research with teachers has shown that LADs can, indeed, support student learning. However, due to the novelty of the field and at times conflicting regulatory principles and frameworks when implementing LA, LAD design and use are often not informed by how the actual students would engage with them. This creates a dialectical tension – LA is for students and about student learning, but students are often not part of that conversation. A recent study by Rets et al. (2021) aimed to address this gap. By building on the previous studies on OUAnalyse with teachers, this study contributed to research by further capturing student perceptions about the usefulness of this tool.
The study
The study analysed stimulated recall interview and log files data from 21 undergraduate students at the OU. The research session with each participant took place remotely on Skype. In the first part of the research session, the interviewer shared their screen with the LAD with each participant, in which their own data from the course were displayed. As the interviewer was browsing the LAD, participants were asked to verbalise what they saw in the LAD, as well as to comment on their learning behaviours when interacting with the different LAD elements. In the second part of the session, the interviewer stopped sharing their screen and asked participants general questions about their experience of seeing the LAD and their LA data for the course.
The study elicited three sets of findings:
- While all participants supported the idea of the LAD, not all LAD elements were perceived as equally useful. Amongst the LAD features favoured by students was the potential to receive study recommendations, whereas comparison with peers was amongst the least favoured elements, unless informed by qualitative information.
- Five factors were found to influence students’ perceptions on the usefulness of the LAD. These included the extent to which students trusted the information in the LAD, their attitudes towards peer comparison, the extent to which they found the LAD informative and motivating to reflect on their approaches to learning. Finally, their overall enjoyment of working with the LAD and whether they highlighted its advantages or suggested improvement were also found to be the substantial factors of influence.
- A link emerged between participant demographics and the perceived usefulness of the LAD. More mature students (> 40 years old) with high self-efficacy, who passed the course with distinction, tended to be more sceptical towards the LAD than younger students (< 40 years old) with low self-efficacy.
Implications
As there was no precedent at the OU to have students comment and reflect on their own LA data, this study offered rich implications for the institutional LA policy and the design of the LAD:
- Student voice should be included alongside other stakeholders’ when designing and researching LADs and, more generally, AI tools in education.
- The study revealed that LADs can be particularly useful in the distance learning context, where students do not have a chance to meet their cohort and benchmark their study progress, or where they can lose sight of their progress due to studying on a part-time basis.
- The OU might consider collecting additional data about students in close consultation with them, to make LA tools more personalised to them, as well as for the purposes of a more accurate representation of their learning.
- The LAD could be used as part of teacher’s feedback on marked assignments to help students reflect on their learning progress. As our study showed, such reflection is important both for the students who feel they are behind or too far ahead with their learning material.
- While the Study Recommender was perceived as most useful in this study, our study also showed that in order for the LAD to be useful for the more mature high-achieving students, it needs to provide more features, which would centre around the insights of effective learning.
More information about the study and its implications can be found using the following reference:
Rets, I., Herodotou, C., Bayer, V., Hlosta, M., & Rienties, B (2021). Exploring critical factors of the perceived usefulness of a learning analytics dashboard for distance university students. Int J Educ Technol High Educ 18, 46 (2021). https://doi.org/10.1186/s41239-021-00284-9
The authors would like to thank OpenTEL for supporting and funding this study.