This work was originally reported on the website of COLMSCT (the Centre for the Open Learning of Mathematics, Science, Computing and Mathematics) – and other work was reported on the piCETL (the Physics Innovations Centre for Excellence in Teaching and Learning) website. Unfortunately, the whole of the OpenCETL website had to be taken down. The bare bones are back (and I’m very grateful for this) but the detail isn’t, so I have decided to start re-reporting some of my previous findings here. This has the advantage of enabling me to update the reports as I go.
I’ll start by reporting a project on iCMA statistics which was carried out back in 2009, with funding from COLMSCT, by my daughter Helen Jordan (now doing a PhD in Department of Statistics at the University of Warwick; at the time she did the work she was an undergraduate student of mathematics at the University of Cambridge). Follow the link for Helen’s project report , but I’ll try to report the headline details here – well, as much as I can understand them!
Computer-marked assignments (CMAs) have been used throughout the OU’s 40-year history. The original multiple-choice CMA questions were delivered to students on paper; responses were entered on OMR forms and submitted by post. A range of statistical tools has been in operation for many years, enabling module team members to satisfy themselves of the validity of individual questions and whole CMAs; these tools were also designed to improve the quality of future CMAs by enabling question-setters to observe student performance on their previous efforts. The primary purpose of Helen’s project was to investigate whether the statistical tools developed for CMAs were also valid for iCMAs, different because of their range of question type, provision of multiple attempts (with relatively complex grading) and inclusion of multiple variants.
No reason was found to doubt the validity of any of the existing tools, though the usefulness of some of them was subject to question and and the different scoring mechanism for iCMA questions (linked to multiple attempts) meant that the recommended ranges for the test statistics were likely to be different for iCMAs. The tests were run against several iCMAs and Helen and I recommended new empirically-based ranges. She also recommended some alternative and additional statistical tests that might be of use in alerting module teams to discrepant behaviour of iCMAs, individual questions and particular variants.
Statistics for the performance of the iCMA as a whole
The previously calculated statistics were: mean, median, standard deviation, skewness, kurotosis, coefficient of internal consistency, error ratio and standard error.
For iCMAs, the recommendations are: module teams should be told the mean, median, and standard deviation (with recommended ranges for mean and standard deviation).
Module teams should be told the standard error (calculated according to a simplified definition and with a recommended range) along with a new statistic, the ‘systematic standard deviation’. If the standard error is too high, then students of a similar ability are likely to get significantly different marks; if the systematic standard deviation is too low then the iCMA does not discriminate well between students of different abilities.
One of the common causes of a high standard error is that there are too few questions in the iCMA. However, in many cases, the iCMA under consideration forms only part of the assessment of a given student. In these cases, it does not really matter if the standard error of one particular iCMA is relatively high, provided that the standard error of the combined assessments is low. To counter the effect of the number of questions, it may also be useful to quote the standard error multiplied by the square root of the number of questions (again with a recommended range).
Coefficient of internal consistency and error ratio should not be quoted, since these are related to the standard error and the standard deviation and so do not add any further information.
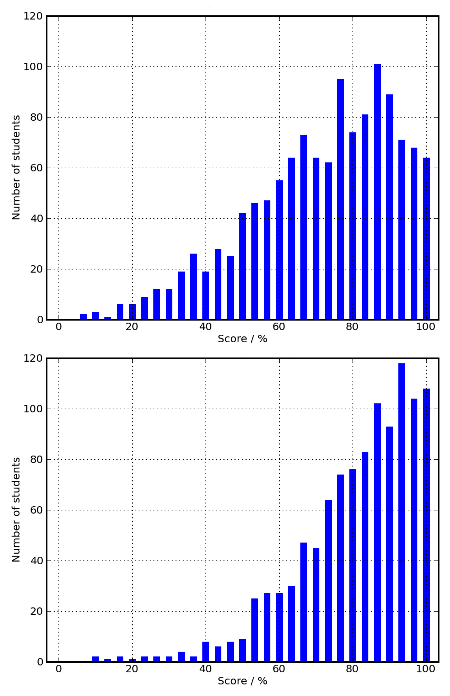
Module teams should not be told the skewness or kurtosis since these are used to determine whether data seems to be normally distributed, but here we already know that the overall scores are not normally distributed. Instead, module teams are advised to look at histograms showing the overall distribution of student scores. The upper histogram in Figure 1 shows a reasonable distribution of scores whilst the lower histogram illustrates a situation in which a large number of students have very high scores.
Figure 1 Two histograms demonstrating different behaviours
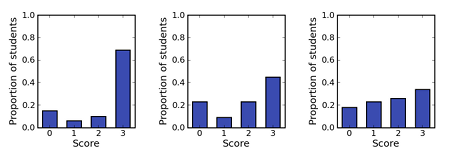
Module teams are also advised to look at the proportion of students scoring 0, 1, 2 or 3 marks per question. If too many students either get questions right at the first attempt or not at all, then the students did not gain much from being allowed multiple attempts. This may suggest that the feedback in this iCMA is not very useful to students.
Statistics for the performance of individual questions
| 95%-100% | Extremely easy |
| 90%-95% | Very easy |
| 85%-90% | Easy |
| <40% | Difficult |
 Figure 2 The proportion of responses marked 0, 1, 2 or 3 for three iCMA questions.
If a higher proportion of students are scoring 0 than are scoring 1 or 2, this may indicate that students do not understand the feedback provided sufficiently well to enable them to correct their previous attempt at the question. Module teams should be alerted when questions exhibit this behaviour.
The use of the new statistical tools that were developed to investigate whether the different variants of a question are of equivalent difficulty has already been described. More recently, we have also investigated the overall impact on students’ scores of receiving different variants.


Pingback: e-assessment (f)or learning » Blog Archive » Random guess scores