You are here
- Home
- Systems thinking and practice for sustainability in a climate changing world
Systems thinking and practice for sustainability in a climate changing world

Climate change is not new. Ever since there was a climate on Earth, repeated cycles of ice ages and warming have occurred naturally over billions of years.
But rapid industrialisation of many economies has altered the Earth’s climate system. Emissions of CO2 and other greenhouse gases from human activities has increased from less than 1 billion tons per year in 1800 to 35 billion tons per year in 2020. There is now widespread agreement by the scientific community that current global warming is unequivocally the result of human influence.
More intense storms, floods and drought and also greater variability in weather patterns are already happening. These have major implications for the environment, biodiversity and for humans including our water, food, energy systems, health, mortality, and long-term viability of our cities, communities, regions and even some nations.
In little more than 200 years – a blink of the eye in planetary and evolutionary terms[1] - humans have created a world system which is climate changing.
As we are all part of the climate changing system, we now need to develop our capacity for systems thinking and practice if we are to be more sustainable. This begins by understanding what we mean by a system.
A system is an assembly of components connected together in an organised way from the perspective of the person distinguishing the system. This organised assembly of components does something – it has a purpose. The system boundary and purpose is chosen by someone – they decide what to include and what to exclude from the system.
We can use the idea of a system to understand our role in the climate changing system. One way of doing this is to draw it. In Figure 1.1 I have drawn a systems map of my climate changing system.
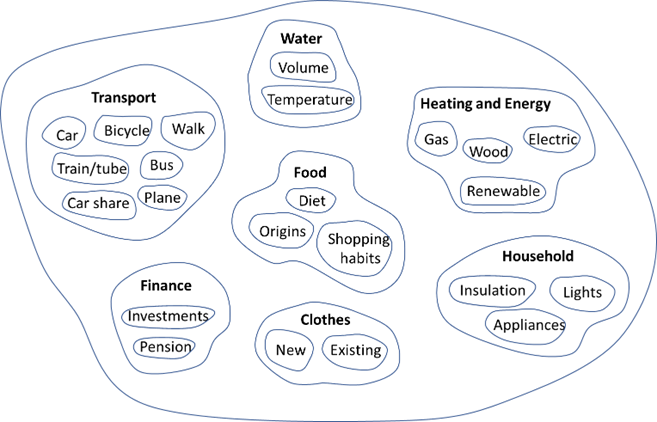
Figure 1.1 My climate changing system
You can see from the systems map that my climate changing system includes a number of areas or subsystems: water use, food, transport, heating and energy and so on. Within each of these, are several elements. Having drawn this map I can now use it to understand how I contribute to climate change and then explore each part in more detail. For example, is my pension invested in companies with ‘good’ or ‘poor’ climate performance? Can I reduce both the volume and temperature of water used in the household? Can I make changes in my diet or shopping habits?
Answers to these questions are sometimes relatively easy. For example, reducing water use will reduce the energy and chemicals used for purifying and pumping and therefore reduce CO2 emissions and also improve rivers and biodiversity. Reducing the temperature of the hot water by a few degrees will also save energy. But in the case of pensions and investments, I would need to investigate and find out more information.

Figure 2 Using less water reduces CO2 emissions associated with storage, purification and pumping and also retains water in rivers and ground improving biodiversity
Drawing the systems map is not meant to create guilt or increase anxiety because not everyone has access to the same range of choices to act for a variety of social, cultural and financial reasons. But it is a way of identifying some of the easier changes that you may wish to make.
The systems map has some other very useful features and advantages.
First, I can update it as my own learning develops and as I make changes. I can add or delete elements or develop a new separate map just on one section e.g how my clothes choices create climate change.
Second, I can share it. Showing this map to others – perhaps members of household or friends - is a rapid way of communicating how I change the climate and provides the basis for discussion, learning and possible collaboration with others. How would your systems map compare to mine?
Third, my systems map is neutral. This is really important because rather like an ordinary map it is providing me with the landscape and main features of my climate changing activities. It is not making a judgement about the rights or wrongs of what I do or do not do. Whether and how much I can or am willing to change is a separate discussion. But having drawn the map I can choose to review any of the areas and reshape my own climate changing system.
The final advantage of my map is that it shows a climate changing system. Any of the elements in it can lead to either climate warming or climate cooling in relation to my own activities. Taking a car or plane is probably a climate warming choice. Going by my bike instead of by my car is a climate cooling choice.

Figure 2.1 Using a bicycle - a climate cooling choice compared to a car
This is not to say my individual actions will lead to global cooling. But using the systems map in this way can help to regain a sense of responsibility and also individual control and action about climate change.
Global warming is not inevitable. It is the result of our collective choices. Using a systems map of our own climate changing system can help us begin to learn about and make more sustainable choices.
This article is an opinion piece that was been written by Kevin Collins, Senior Lecturer, STEM, Engineering & Innovation, in Novemeber 2022 as a response to a call for articles from our OU colleagues, that relate to climate change from their own disciplinary or lived experience.
[1] If the Earth’s age was compressed into a year, 200 years represents about 1.5 seconds.
Related articles
- Supporting climate action through digital education: new free BOC 26th February 2024
- Introducing a new free course - Climate Psychology: facing the climate crisis 8th February 2024
- Climate Change and machine learning - Climate Perspectives 8th February 2024
- Go Green: What is eco-anxiety? 8th February 2024
- Go Green: Fashion Fixing and Mending 8th February 2024


Explore

Undergraduate
Postgraduate
Policy
-
Follow us on Social media
-


