Agent Based Modelling and Scholarship

By Kevin Amor
Recently I have started to use Agent Based Modelling (ABM) in my finance research. It occurred to me to wonder whether it had a place in scholarship work. A very quick search found some listings for ABM in school-level education work but very little with applications for scholarship within higher education. With that in mind I thought I would set myself the task of designing and running a small experiment. The experiment outlined below is not at all rigorous academically and is instead designed to illustrate the potential of ABM to this blog’s more creative readers.
What is agent based modelling and how is it done?
Per a leading scholar in the subject (and architect of the Netlogo software we discuss below), “Agent-based Modeling (ABM) is a methodology that enables modelers to create models that connect the micro and macro level. They represent the micro-level as agents with characteristic behaviors and as the agents execute their behaviors, macro-patterns emerge. Thus they enable a natural representation of “emergent phenomena”, which are notoriously difficult to comprehend. With ABM, we can model a wide variety of phenomena, such as the emergence of galaxies from the interactions of stars, the emergence of traffic jams from the behaviors of drivers, economic patterns from the behavior of buyers and sellers, spreading of diseases from individual contacts on a network” (Wilensky, 2017).
For example in my current research I am using ABM to explore how financial markets in developing markets should be encouraged to develop to optimise their efficiency. I am also using it to explore the impact of imperfect labour markets.
In ABM we design a model by establishing a set of rules that our ‘agents’ will follow. In the demonstration below, the agents are students and tutors, for example. We then allow the agents to interact with each other subject to given parameters and where appropriate varying elements of randomness. After the system has developed we can collect the desired data and run it again and again, each time either sticking to the same value of parameters or changing them in some specified manner. Due to the element of randomness each run will present a different set of results, which we can then collate and analyse.
A leading software package used for this task is Netlogo, written by Uri Wilensky. This is a free open-source package maintained by the Northwestern University (https://ccl.northwestern.edu/netlogo/download.shtml).
An example experiment
I shall take you through the steps of a very simple experiment. This took me about 3 hours to design, write the code and run. The experiment wants to examine the role of collaboration in improving learning in tutorials. It models learning achieved in a tutorial (take a deep breath here – I promised something not particularly academic!) as occurring due to a combination of the ability of the tutor (however that is defined), the latent ability of the student (ditto) and the sum total of ability of fellow students in a randomly allocated breakout group.
First then, five tutors are created and assigned a random ability ranging from 50 to 100. These can easily be varied during the multiple simulations. This ability is distributed uniformly but normal distributions are possible in the software. Each tutor is allocated 20 students, who themselves are randomly allocated an ability, ranging from 30 to 100. The students within each group are then allocated randomly into a breakout group with a selection of fellow students.
We then model the attainment as being a weighted combination of all of the above influences, with the user choosing the weightings. The formula used is:
Attainment = (weighting of tutor x tutor ability) + (weighting of student x student ability) + (weighting of student x sum of ability of fellow break-out students)
We can then run this over and over with different random allocations of abilities, and tutor-student allocations and breakout etc to assess how many students reach a pre-determined user-set attainment level. Finally the software will dump the results into a spreadsheet for further analysis.
The model in Netlogo
Set up
First we set up the groups and subgroups (figure 1). The students are all linked to the tutor (in the middle) and are then linked to fellow students in the same breakout group. All students in the same breakout group share the same colour.
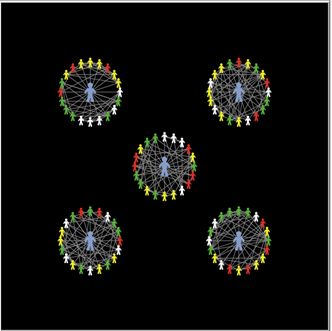
Figure 1 Group allocation
Parameters
Next we set the various parameters which we wish to use (see figure 2). There is no limit to these and they can be varied.
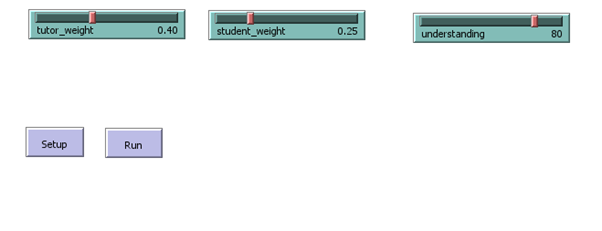
Figure 2 The parameter selections
In this simple model we only vary the weighting given to the tutors’ contribution (40% in this run), students’ contribution (25%) and the target level of attainment (80%).
Visualisation
An important strength of Netlogo is its ability to show a system developing. With our model the students are shown as people (see figure 1) whose colour symbolises which break-out group they have been allocated.
However once the tutorial has occurred the model shows those students who have exceeded the set attainment benchmark as a smiley face and those who have not as a sad face. See figure 3.
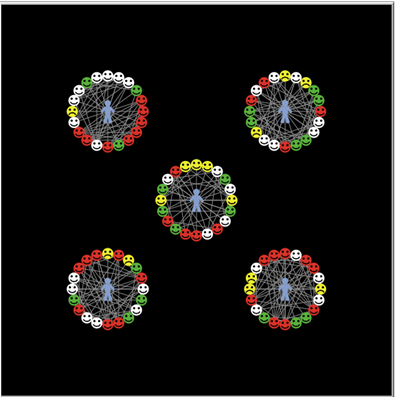
Figure 3 The students’ attainment at the end of the tutorial
Outputs
Next we decide what outputs we would like. For this experiment I am going to add:
a) a histogram of student ability at the start of the tutorial;
b) a histogram of their attainment at the end;
c) average ability at the start;
d) average attainment at the end;
e) average tutor ability;
f) proportion of students who have exceeded set benchmark.
See figure 4 for a typical output after a run.
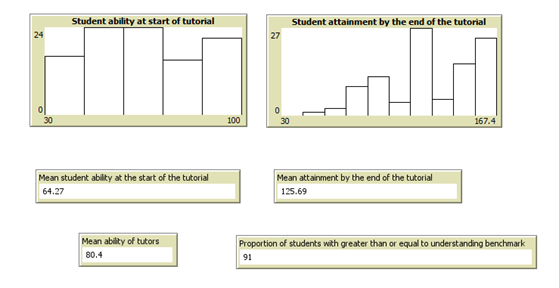
Figure 4 A typical set of outputs
Multiple runs
Because of the random nature of the model (various allocations of ability, tutor groups and break-out groups) we need to be able to run the model numerous times to arrive at a reasonably sized data set from which to infer behaviours. Netlogo has an extra set of software, ‘behavior space’ that allows us to run the model as many times as we like whilst also changing the parameters in a structured manner.
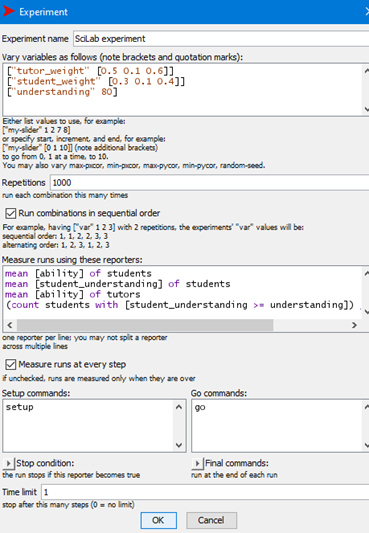
Figure 5 Netlogo’s ‘behavior space’ for multiple runs
In figure 5 you can see that each iteration will comprise 1,000 runs and the tutor weighting will be varied from 0.5 to 0.6 in increments of 0.1 (so 2,000 runs) and student weighting from 0.3 to 0.4 in increments of 0.1 (an additional 2,000 runs). The target understanding figure has been kept at 80.
The screenshot also shows the four measures that will be collected (mean student and tutor ability, mean student attainment and the proportion of those greater than the target value. All of this data (4,000 runs) will then be dumped into a spreadsheet, as a csv file. This spreadsheet can then be used to undertake some simple analysis in Excel or imported into a statistics package such as R. The 4,000 runs took about 2 seconds to run on my Open University (OU)-provided laptop. Hence you can see that a vast amount of data can easily be generated once a useful model has been designed.
The analysis may take a bit longer though….
Conclusion
Hopefully this play experiment has been useful for those not familiar with the idea of ABM or the software available to support it. There is a reasonably steep learning curve in getting to grips with the code needed to generate the models within Netlogo; however, as with everything there are helpful resources on the internet. These include sites where researchers have shared their existing models on an open source basis, which one can take as a basis for extending their work. Alternatively ABM models often have applications in very different disciplines – a model of fire spreading through a forest has applications in epidemiology, for example. For such shared models see for example, http://ccl.northwestern.edu/netlogo/models/community/index.cgi or http://modelingcommons.org/account/login
Happy modelling!
This blog represents the views of the individual, not SCiLAB or the Open University.
Reference
- Wilensky, U, 2017, What is agent-based modelling and why might it be useful? , accessed 11 May 2022

Kevin Amor
Kevin has a masters degree in online and distance education and has published papers to the OU’s scholarship repository exploring different aspects of the students’ experience of studying accounting and finance. He is a fellow of the Higher Education Academy.

Blog posts


Explore

Undergraduate
Postgraduate
Policy
-
Follow us on Social media
-


