Emotional reactions to feedback

This will probably be my final post relating to the Assessment in Higher Education Conference and it relates to an excellent presentation I went to entitled ‘Feedback without Tears: students’ emotional responses’. The presentation was given by Mike McCormack from Liverpool John Moores University and two of his students and, perhaps as you would expect from a teacher of drama and two drama students, it was excellent.

The work described was an HEA funded project in which students interviewed their fellows about positive and negative emotional responses to feedback. Most students reported having had positive and a negative emotional responses to feedback received, and some of the negative reactions were long-lasting and unresolved.

Some of the tentative conclusions and recommentations are that:

  • wherever possible, feedback should be given in a verbal discussion;
  • lecturers should ‘have the time’ to discuss feedback with students (and make sure this is clear to their students);
  • lecturers should give suggestions for improvement rather than focusing on what is wrong;
  • we should avoid confusing disparity between marks and feedback;
  • we should ensure that students understand that we can’t reward effort alone;
  • we should be aware of students’ perceptions of power imbalance and of differing understandings of specialist discourse.

One of the suggestions made was that drama is an emotionally charged subject, so perhaps students in a different subject area – like physics – would be less emotional. That may be true, generally, but on the highly scientific basis of a sample of one physicist (me!) I don’t think it is. Physics students may react less emotionally to drama students, but that doesn’t mean that they are not sometimes hurt by feedback received. Now, whether that is necessarily a bad thing is another matter all together – sadly, dealing with negative feedback is something we all (as actors or physicists or teachers) need to be able to do in ‘real life’. It was an extremely interesting and thought-provoking presentation.

Posted in emotional reaction | Tagged , | Leave a comment

Assessment literacy

I said I’d post on two topics from the Assessment in Higher Education Conference. This is actually another one (my ‘second’ topic will follow), but noticing (a) Tim Hunt’s excellent summary of some of the things I wanted to say and (b) that this is my 200th post, I wanted to talk about something that I care about passionately. I’m picking up on ideas from Margaret Price’s keynote at the conference and from Tim’s summary, but this is essentially my own take on…Assessment literacy.

We wonder why some of our students plagiarise. We wonder why, when they are allowed to repeat iCMA questions as often as they want to, some students click through so as to get the ‘right answer’ for entry text time, so as to get the credit – without looking at our lovingly crafted feedback. The simple answer is that many of our students don’t share our understanding of what assessment is for. We may think we are firmly in the  ‘assessment for learning’ mode, but if our students don’t understand that, what’s the point?

This is related to the problem that arises when students don’t understand an assessment task or the feedback provided, but the problem I’m describing is at a higher level. I’m talking about students simply not ‘getting’ what we think assessment is for – we want assessment to drive learning, but they remain driven by marks. To be fair to our students, I think that in many cases I’m talking about students simply not ‘getting’ what assessment is for because we don’t tell them – so perhaps there is an easy solution. I think the same is true of other aspects of teaching and learning, and it would help if we remembered that our students are not necessarily ‘like us’, so sometimes we need to explain our motivations more explicitly.

I drew another point from Margaret’s keynote that I’d like to mention. We are too much driven by NSS scores. In that, perhaps we are very like our students, driven by marks…I suppose it is too much to hope that a day might come when we actually cared about our students and their learning rather than University X’s ranking in some artificial league table. Ah well, we can hope.

Posted in assessment literacy | Tagged , , | Leave a comment

When the numbers don’t add up

I am in a (very brief) lull between the Assessment in Higher Education Conference, CAA 2013, masses of work in my ‘day job’ and a determination to both carry on writing papers and to get some time off for walking and my walking website. The Assessment in Higher Education Conference was great and, hopefully before CAA 2013 starts on Tuesday, I will post about some of the things I learned. However first, I’d like to reflect on something completely different.

During the week I was at an Award Board for a new OU module. All did not run smoothly. The module requires students to demonstrate ‘satisfactory participation’, but we’d used a horrible manual process to record this. Not surprisingly, errors crept in. Now the OU Exams procedures are pretty robust and the problem was ‘caught’. We stopped the Award Board, all the data were re-entered and checked, checked and checked again and we reconvened later in the week – and brought the board to a satisfactory conclusion. My point is that people make mistakes.

Next I would like to reflect on the degree results of one of my young relations at a UK Russell Group University. She got a 2:1, which was what she was aiming for, but was devastated that she ‘only’ got 64%, not the 67% she was aiming for. Now this is in a humanities subject – how on Earth can you actually distinguish numerically to that level of precision?

My general point is that, given that humans make mistakes – and even if they don’t their marking is pretty subjective – why do we persist in putting such faith in precise MARKS. It just doesn’t add up. I am pretty confident that, at our Award Board, we made the right decisions at the distinction/pass/fail boundaries and I am similarly confident that my young relative’s degree classification is what was demonstrably achieved. I’d reassure those of you who have never sat on a Award Board that considerable care is taken to make sure that this is the case. However, at a finer level, can we be sure about the exact percentage? I don’t think so.

Posted in marking accuracy | Tagged | Leave a comment

How good is good enough?

Listening to the radio this morning, my attention was drawn to a new medical test with an accuracy of ‘more than 99%’. I was left thinking ‘well, is that good enough?’ and then ‘so is a marking accuracy of 99% good enough for e-assessment questions?’ (Actually the situation with the medical test is not as simple as I’d thought – the idea is that this test would just be used to give a first indication. That’s better.)

Returning to e-assessment. Well no, on one level 99% accuracy is not good enough. What about the 1%? But the e-assessment is likely to be considerably more accurate than human markers. And students are more likely to be confused by something in the question (which may be as simple as reading an addition sign as a division) than they are to be marked inaccurately by the system. Clearly this is something that we must continue to monitor, and to do our best to improve accuracy of marking (whether by humans or computers). And it matters even in purely-formative use, because if our answer matching is not correct we will not be giving the correct feedback message to the students.

Posted in marking accuracy | Tagged , | 1 Comment

Transforming Assessment webinar

I gave a webinar yesterday in the ‘Transforming Assessment’ series, on “Short-answer e-assessment questions: six years on”. The participants were lovely and I was especially pleased that there were lots of people I didn’t know. There is a recording at http://bit.ly/TA5J2013 if you’ve interested.

The response yesterday was very encouraging, but I remain concerned that more people are not using question types like this. However I rest my case that you need to use real student responses in developing answer matching for questions of the type we have written. That’s fine for us at the OU, with large student numbers, but not necessarily for others.

Then, in the feedback from participants, someone suggested that they would value training in writing questions and developing answer matching. I would so much like to run training like this, but simply don’t have the time.

But, thanks to Tim Hunt, we have another suggestion. I have recently used the Moodle Pattern Match question type to write very much simpler questions, which require a tightly constrained single word answer – like the one shown below.

If you are interested in using Pattern Match, writing questions like this would give a simple way in – and you’d probably get away with developing the questions without the need for student responses beforehand (though I would still monitor the responses you do get).

Posted in short-answer free text questions | Tagged | Leave a comment

Same assignment, different students 3

You’ll be getting the idea…

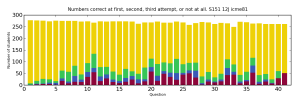
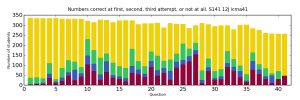
The figures below show, for each question, the number of students who got it right at first attempt (yellow), second attempt (green), third attempt (blue), or not at all (maroon). So the total height of each bar represents the total number of students who completed each question.

You can spot the differences for yourself and I’m sure you will be able to work out which module is which! However I thought you’d like to know that questions 24-27 are on basic differential calculus. Obviously still some work to do there…

Posted in question analysis, student engagement | Tagged , , | 1 Comment

Quote of the day

This one comes from Carl Wieman who won the Nobel Prize for physics in 2001. I’ll start with a quote which gives the broader flavour of the paper:

[pg10] [we should] ‘approach the teaching of science like a science. That means applying to science teaching the practices that are essential components of scientific research and that explain why science has progressed at such a remarkable pace in the modern world.
The most important of these components are:
• Practices and conclusions based on objective data rather than—as is frequently the case in education—anecdote or tradition.This includes using the results of prior research, such as
work on how people learn.
• Disseminating results in a scholarly manner and copying and building upon what works. Too often in education, particularly at the postsecondary level, everything is reinvented, often in a highly flawed form, every time a different instructor teaches a course. (I call this problem “reinventing the square wheel.”)
• Fully utilizing modern technology. Just as we are always looking for ways to use technology to advance scientific research, we need to do the same in education.’
[I’m not sure I necessarily agree with the final point – I’d use technology when, and only when, that is beneficial to the student experience.]

Relative to this, the point I want to emphasise sounds timid:

[pg13] ‘Even the most thoughtful, dedicated teachers spend enormously more time worrying about their lectures than they do about their homework assignments, which I think is a mistake.’

But it is oh so true – certainly in my own institution, relative to the time and effort that goes into developing our (excellent) teaching resources, we put so little time and effort into getting assessment right. I think that’s a mistake! Your institution may be different of course, but I doubt that many are.

Wieman, C. (2010). Why not try a scientific approach to science education? Change: The Magazine of Higher Learning, 39(5), 9-15

Posted in quotes | Tagged | Leave a comment

Same assignment, different students 2

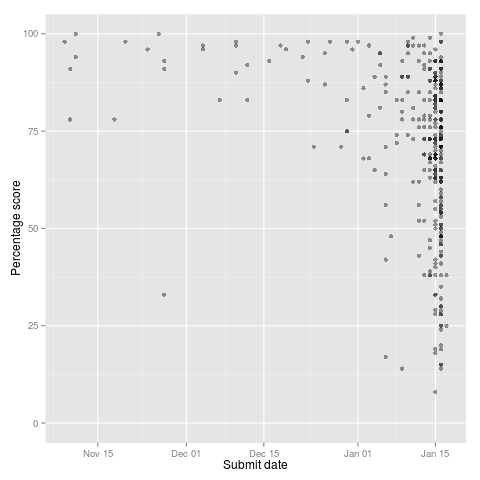
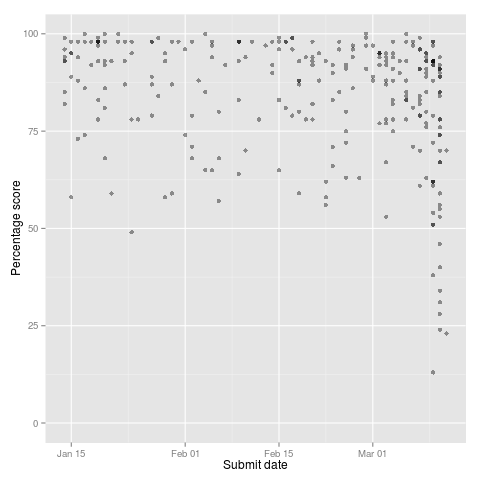
Following on from my previous post, take a look at the two figures below. They show how students’ overall score on an iCMA varied with the date they submitted. These figures are for the same two assignments as in the previous post (very similar assignments, rather different students).

The top figure (above) is depressingly familiar. The students who submit early all do very well – they probably didn’t need to study the module at all! The rest are rushing to get the assignment done, just before the due date – and lots of them don’t do very well.

I am very pleased with the lower figure. Here students are doing the assignment steadily all the while it is available – and with the exception of a small number who were probably prompted to have a go on the due date by a reminder email we sent, they do pretty similarly, irrespective of when they submitted. This is how assignments should perform!

I’m aware that my interpretation may seem simplistic, but we have other evidence that the first batch of students are overcommitted – they are also younger and have lower previous qualifications – so it all fits.

Finally, following yesterday’s JISC webinar on learning analytics I’m beginning to think that this is how I should be describing the work that I’ve previously categorised as ‘Question analysis’ and  ‘Student engagement’. However we describe this sort of analysis, we must do more of it – it’s powerful stuff.

Posted in question analysis, student engagement | Tagged , , | Leave a comment

Same assignment, different students

I’ve written quite a lot previously about what you can learn about student misunderstandings and student engagement by looking at their use of computer-marked assiggnments. See my posts under ‘question analysis’ and ‘student engagement’.

Recently, I had cause to take this slightly further. We have two interactive computer-marked assignments (iCMAs) that test the same material, and that are known to be of very similar difficulty. Some of the questions in the two assignments are exactly the same, most are slightly different.  But when we see very different patterns of use, this can be attributed to the fact that the two iCMAs are used on different modules, with very different student populations.

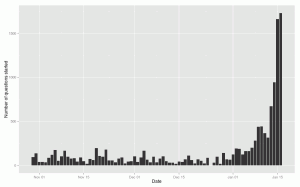
Compare the two figures shown below. These simply show the number of questions started (by all students) on each day that the assignment is open. The first figure shows a situation where most questions are not started until close to the cut-off date. The students are behind, struggling and driven by the due-date (I know some of these things from other evidence).

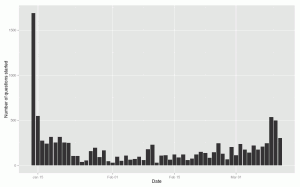
The second figure shows a situation in which most questions are started as soon as the iCMA opens – the students are ready and waiting! These students do better by various measures – more on this to follow.

Posted in question analysis, student engagement | Tagged , | 2 Comments