By Ben Langdown
Week 2 of Wimbledon is in full flow, as is my second week at The OU having taken on the position of lecturer in Sports Coaching within the Sport and Fitness team. As is customary at Wimbledon time, I am sat here typing this with a punnet of strawberries and cream and a glass of Pimms in hand, flicking my eyes left to right, and back again as a pressurised ball of yellow fluff gets whacked across a taut net and to within millimetres of a chalked line at the back of centre court! Murray is through to the quarter-finals for the 9th consecutive year after beating Nick Kyrgios comfortably in Monday’s last 16 match. This was despite Kyrgios achieving 90% accuracy on his first serve through the first set, 84% over the whole match and averaging 124mph! Murray wasn’t quite as accurate with a mere 64% of his first serves finding the service box, but did clock up an impressive 130mph fastest serve. So how are these top players able to serve the ball so fast but also be so consistently accurate?
First, let’s go back to my refreshments, the strawberries and Pimms are very relevant here I must add…Successfully picking up the glass of Pimms and guiding it to my mouth to have a swig without spilling any has resulted from me developing the ability to self-organise hand-to-glass and then glass-to-mouth movements when I was much, much younger! However, novice movements aren’t this smooth and successful. At first new movements are often robotic in nature, consciously controlled and performed using rigid coordination. This is the beginner’s attempt to simplify the skill as much as possible by freezing some of the possible movements in their joints. This is what we call, freezing degrees of freedom (the number of possible movements available at each joint involved in the movement) which allows a beginner to limit the amount of movement variability and achieve more success when first learning a skill. They may not use the most efficient or effective technique but they can achieve an outcome i.e. having a drink!
Whilst novice performances are characterised by this freezing of movements, dynamical systems theorists suggest that the variability in movements, in response to task goals, is an intrinsic part of skilled motor performance and as a result allows performers to adapt and be flexible in their dynamic sporting environment. Often there is a lot of ‘detrimental movement variability’ that impacts upon our success as a novice learner and this is why a lot of mistakes will be made (in my example – drinks spilt!). As we progress, we learn to “unfreeze” our joints’ degrees of freedom, allowing an increased number of movement combinations to be effectively self-organised in response to the goals of the task. So, in my example I can successfully drink from the glass by moving it from the table to my mouth on a variety of trajectories / movement paths, the glass may be at different angles each time, my hand may be holding the glass lower down or higher up, there is no set “motor programme” as was once thought, variability is a part of movement and as long as I am aware of how to adapt my movements to reach the end goal then I will get the glass to my mouth successfully. Through practise we are then able to use this ‘functional variability’ to become successful at performing the task in different environments and with varying constraints imposed on us as performers.
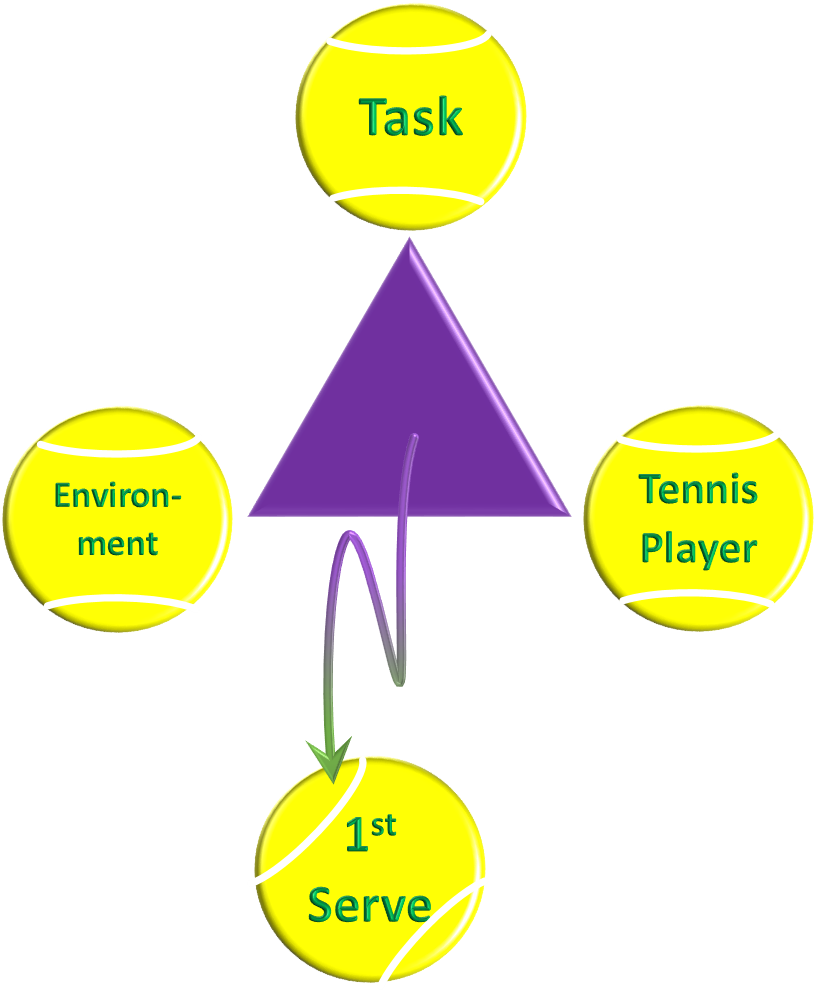
This also applies in tennis; the elite players we witness over the fortnight at SW19 are able to benefit from the practise they have put in to allow successful 1st serves to emerge from constraints in three interacting areas: the task, the environment and the player:
Task Constraints (the 1st serve): e.g. where they want to hit the serve, what spin do they want to place on the ball, the rules governing the service, how high has the ball been thrown etc.
Environmental Constraints (Centre Court): e.g. the crowd, the wind – irrelevant when the roof is closed on centre court!
Player Constraints: e.g. how much range of movement do they have in their shoulder, are they carrying a niggling injury that’s causing them pain, what state of mind are they currently in, are they focussed on the task in hand or have they just thrown away an easy point etc. The second set of Monday’s match demonstrated this point nicely where Kyrgios appeared to give up!
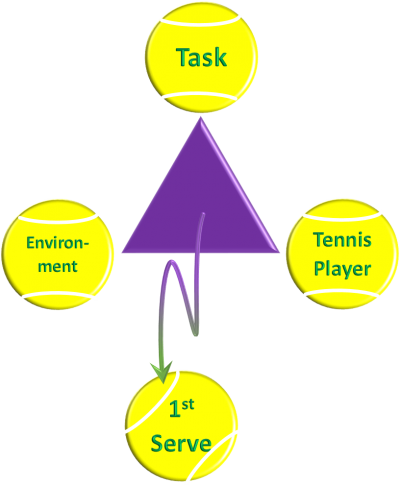
Figure 1.0 Dynamical Systems Theory adapted to the 1st serve in tennis: The serve emerges from the interacting constraints.
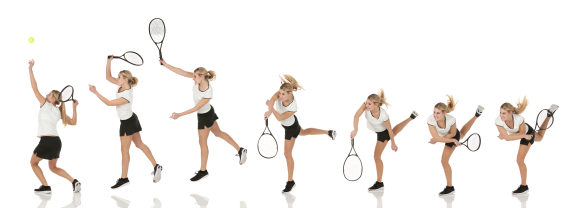
So how does a novice progress to the level of skill we see at Wimbledon? When attempting a serve, beginners may miss the ball, or hit into the net as they try to coordinate all the movements available at their shoulder, elbow, and wrist. Excluding the movements in the hand (which will be gripping the racket), there are 7 degrees of freedom in the arm:
- 3 possible movements in the shoulder
- 1 in the elbow
- 3 in the wrist
Coordinating these can be a tricky task, hence why variability in the movements of these joints can lead to unsuccessful serves. It is also possible to see why beginners would freeze the lower body and even the wrist and elbow movements to make the serve easier to control (coaches often call this a frying pan service with just the arm moving and no turn of the hips!). In order to hit the ball like Murray and his peers at over 130mph the rest of the body also needs to be self-organised…for now though, we’ll freeze that discussion and just stick with the arm and racket!
Research (e.g. Bootsma, & Van Wieringen, 1990; Betzler, et al., 2012) has shown that when performing the same task over and over elite performers are able to “zero in” on contact with a ball and in this tennis example, serve the ball from the centre of the racket. This means that as the ball is tossed into the air the player can utilise functional movement variability to adjust the position of the racket as it moves towards the ball. Then, as they approach the critical moment of the serve (i.e. impact between the centre of the racket and ball) the amount of variability is reduced to produce consistency from serve to serve. Novice players do not demonstrate as much ‘funnelling’ of variability which is where the mistakes and unsuccessful serves emerge from. Ok, it’s easy for me to say this sat here at a desk munching on strawberries…but try achieving a 90% success rate at over 120mph for a whole set in front of a centre court crowd, the majority of whom want you to lose to their British hopeful!
I don’t want to fool anyone here, elite players do still suffer from detrimental variability in their movements and this is evident when double faults creep into their game, but let’s face it, it doesn’t happen as often as us mere mortals when on the court playing much slower serves!
So, back to my strawberries and Pimms…the constraints on the goal of getting them to my mouth are currently far less daunting than being out on centre court, racket in hand, with 15000 people watching on, and trying to serve at 135mph into a 283.5sqr.ft service box! I feel the environment and my own ‘performer’ constraints alone would be far too imposing, and that’s before I even consider the task!
Enjoy the rest of Wimbledon and look out for those service stats! Cheers!
Useful references:
Bartlett, R., Wheat, J., & Robins, M. (2007). Is movement variability important for sports biomechanists? Sports Biomechanics, 6(2), 224-243.
Betzler, N.F., Monk, S.A., Wallace, E.S., & Otto S.R. (2012). Variability in clubhead presentation characteristics and ball impact location for golfers’ drives. Journal of Sports Sciences, 30(5), 439-448.
Bootsma, R.J., & Van Wieringen, P.W.C. (1990). Timing an attacking forehand drive in table tennis. Journal of Experimental Psychology: Human Perception and Performance, 16(1), 21-29.
Davids, K., Glazier, P.S., Araújo, D., & Bartlett, R.M. (2003). Movement systems as dynamical systems: The role of functional variability and its implications for sports medicine. Sports Medicine, 33, 245-260.
Gurfinkel, V.S. & Cordo, P.J. (1998). The scientific legacy of Nikolai Bernstein. In M.L. Latash, (Ed.), Progress in motor control: Volume one, Bernstein’s traditions in movement studies (pp. 1-20). Champaign: Human Kinetics.
Langdown, B.L., Bridge, M., & Li, F-X. (2012). Variability of movement in the golf swing. Sports Biomechanics, 11(2), 273-287.
Newell, K.M. (1986). Constraints on the development of coordination. In M.G. Wade & H.T.A. Whiting (Eds.), Motor development in children: Aspects of coordination and control (pp. 341-360). Boston: Martinus Nijhoff.